
1
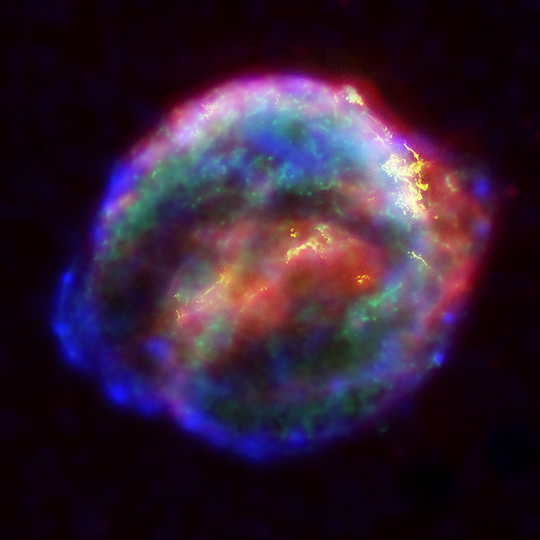
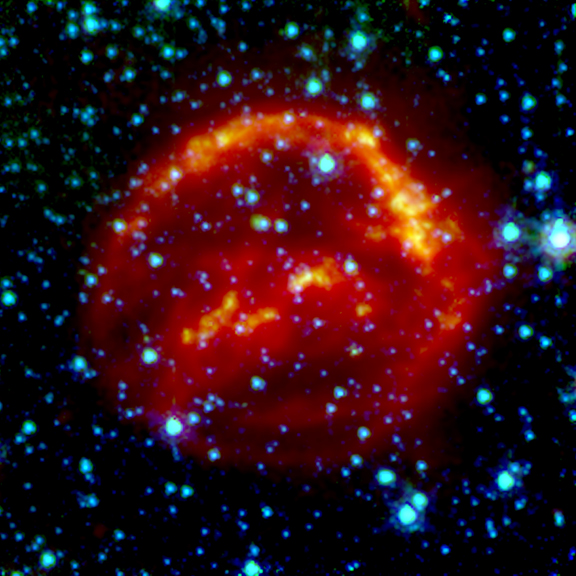
X-ray, Optical & Infrared Composite of Kepler's SNR
On October 9, 1604, sky watchers -- including astronomer Johannes Kepler, spotted a "new star" in the western sky, rivaling the brilliance of nearby planets. "Kepler's supernova" was the last exploding supernova seen in our Milky Way galaxy. Observers used only their eyes to study it, because the telescope was not yet invented. Now, astronomers have utilized NASA's three Great Observatories to analyze the supernova remnant in infrared, optical and X-ray light.
Scale: Image is 5 arcmin across
(Credit: NASA/ESA/JHU/R.Sankrit & W.Blair)
2
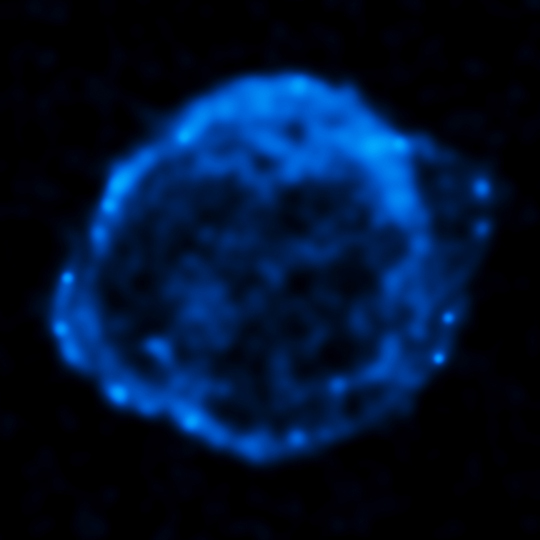
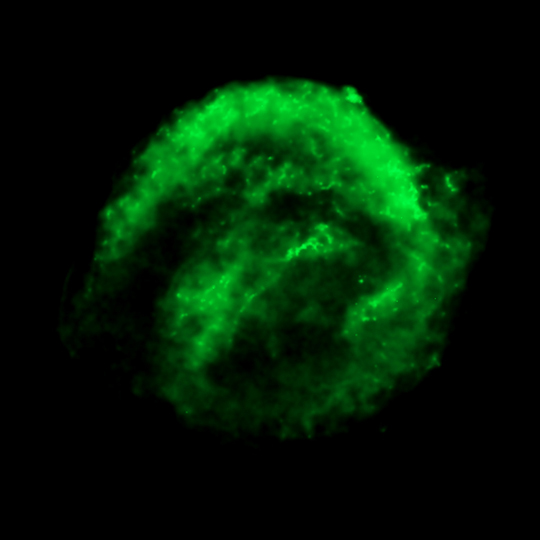
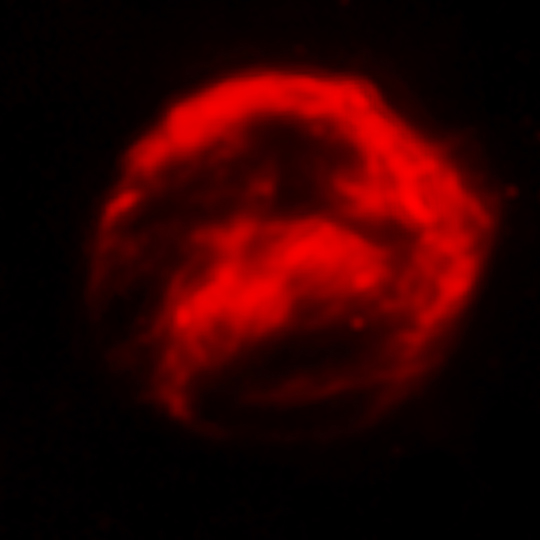
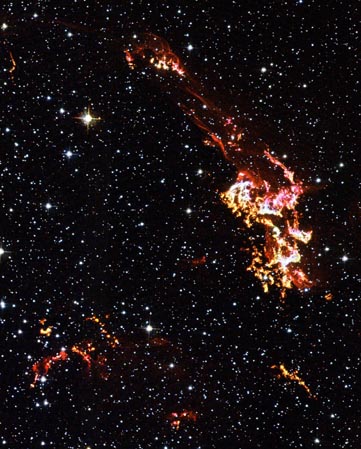
X-ray, Optical & Infrared Images of Kepler's SNR
The X-ray data of Kepler's SNR show regions with multimillion degree gas, or extremely high energy particles. The higher-energy X-rays (blue) come primarily from the regions directly behind the shock front. Lower-energy X-rays (green) mark the location of the hot remains of the exploded star. The optical image reveals 10,000 degrees Celsius gas where the supernova shock wave is slamming into the densest regions of surrounding gas. The infrared image highlights microscopic dust particles swept up and heated by the supernova shock wave.
Scale: Each image is 5 arcmin across
(Credit: NASA/ESA/JHU/R.Sankrit & W.Blair)
3
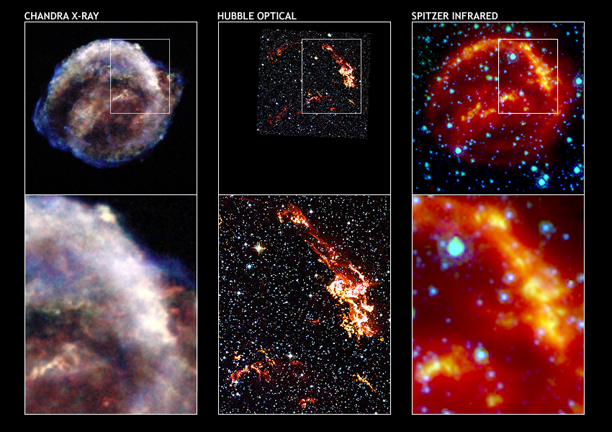
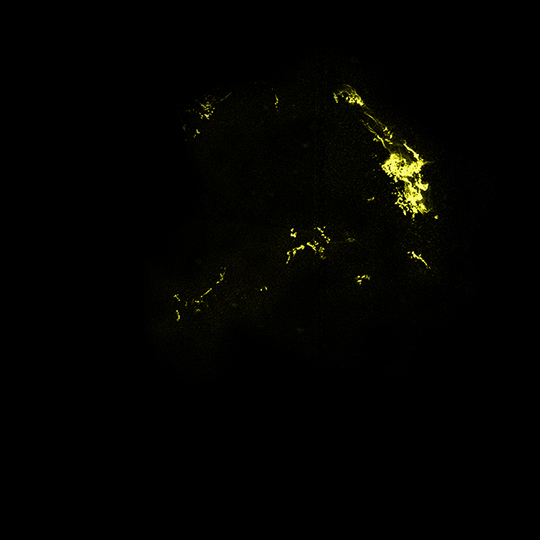
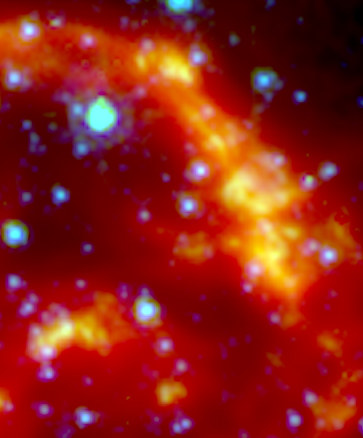
Kepler's SNR: 6-Panel From Chandra, Hubble & Spitzer
These images represent views of Kepler's supernova remnant taken in X-rays, visible light, and infrared radiation. The top panels show the entire remnant. The bottom panels are close-up views of the remnant's upper right corner. The images indicate that the bubble of gas that makes up the supernova remnant appears different in various types of light. Chandra reveals the hottest gas (here shown in red,green & blue), which radiates in X-rays. Hubble shows the brightest, densest gas (yellow), which appears in visible light. Spitzer unveils heated dust (red), which radiates in infrared light.
Scale: Full Field image is 5 arcmin across
(Credit: NASA/ESA/JHU/R.Sankrit & W.Blair)
4
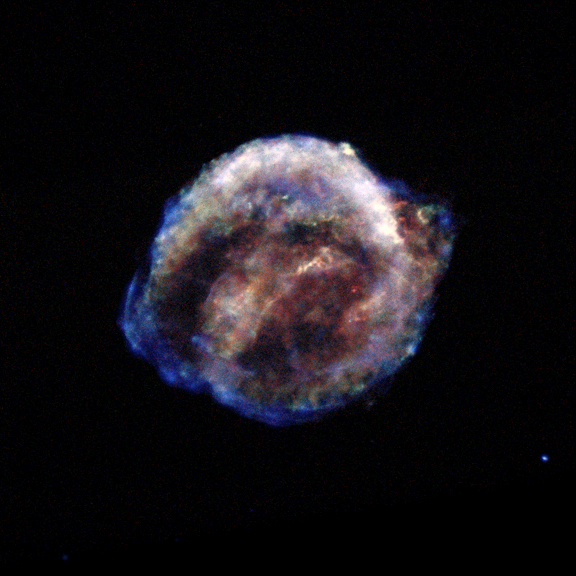
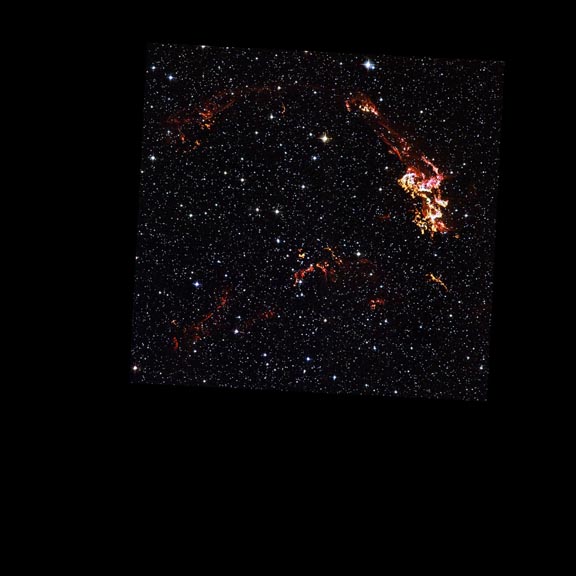
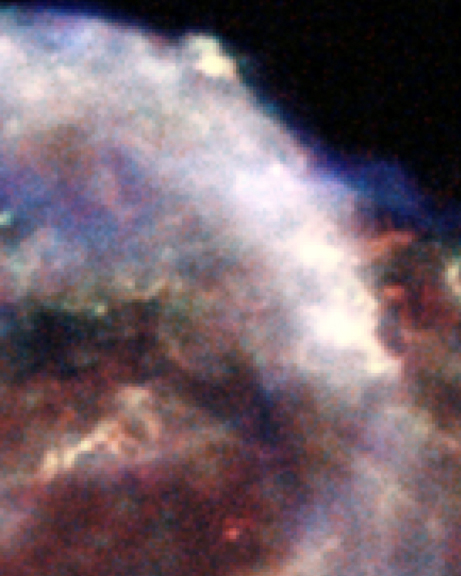
Kepler's SNR: Individual Views From Chandra, Hubble & Spitzer
The Chandra data was taken with the Advanced CCD Imaging Spectrometer (ACIS) on June 30, 2000 for about 14 hours. Hubble's image was taken with the Advanced Camera for Surveys (ACS) on August 28/29, 2003 & May 26, 2004 for a total of 6.5 hours. The Multiband Imaging Photometer for Spitzer (MIPS) and Spitzer's Infrared Array Camera (IRAC) were used to collect data on August 25, 2004 and September 3, 2004 for 1.5 hours.
Scale: Full Field images are 5 arcmin across
(Credit: NASA/ESA/JHU/R.Sankrit & W.Blair)
5
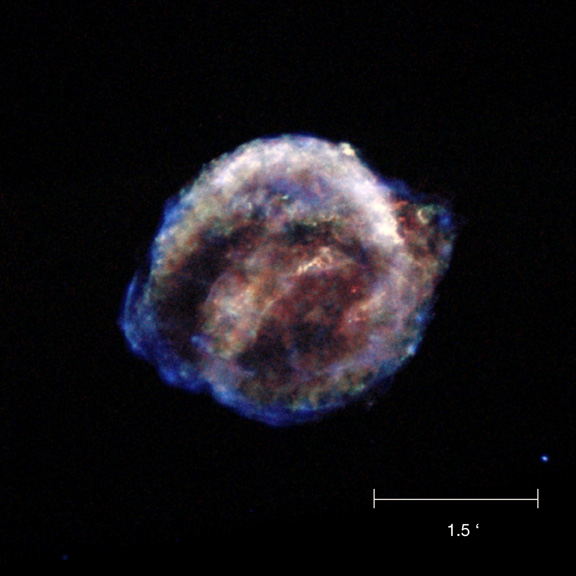
Chandra X-ray Image with Scale Bar
Scalebar = 1.5 arcmin
(Credit: NASA/ESA/JHU/R.Sankrit & W.Blair)
Scalebar = 1.5 arcmin
(Credit: NASA/ESA/JHU/R.Sankrit & W.Blair)
Return to Kepler's Supernova Remnant (06 Oct 04)

Revised: May 17, 2022