X-ray Spectroscopy of Supernova Remnants ds9 Activity
Purpose: To determine types of supernova events by examining Chandra X-ray Observatory images of supernova remnants (SNRs) and by identifying the elements in their energy spectra.
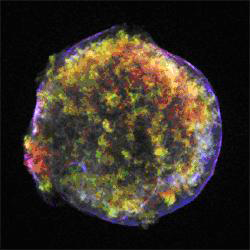
Tycho's Supernova Remnant
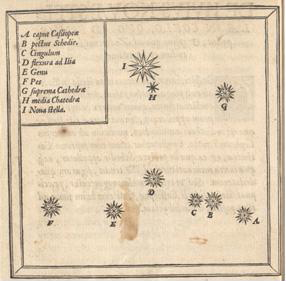
In the year 1572, the Danish astronomer Tycho Brahe observed and studied the sudden appearance of a bright "new star" in the direction of the constellation Cassiopeia. Now known as Tycho's supernova remnant, the event created a sensation in Tycho's time because until then stars were thought to be unchanging. Tycho's observations of this event marked the beginning of the study of astronomy as a science. This object is a Type Ia event - the thermonuclear destruction of a white dwarf. Information about this object is located at http://chandra.harvard.edu/press/05_releases/press_092205.html
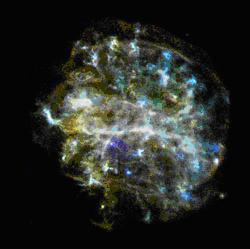
SNR G292.0+1.8
The Type II core collapse of a massive star that produced this supernova remnant ~1600 years ago is located in the direction of the constellation Centaurus. SNR G292.0+1.8 is interesting because it is one of only three oxygen-rich remnants and one of the primary sources of the heavy elements necessary to form planets and people. Although considered a "textbook" case of a supernova remnant, the intricate structure shown here reveals a few surprises. Information about this object is located at http://chandra.harvard.edu/photo/2007/g292/
Tycho’s Supernova Remnant (Type Ia) and SNR G292.0+1.8 (Type II) are representative of the two supernova types. Follow the procedure below to analyze their spectra and determine the elements present in the remnants and their relative abundances. The same procedure will be used to study other remnants, compare the results to Tycho and SNR G292.0+1.8, and determine if they are Type II or Type Ia supernova events.
Procedure:
Install the software and load the FITS file (data/image file):
1.Download and install ds9 (http://chandra-ed.harvard.edu/install_2014.html)
2.Open ds9. From the menus, choose Analysis>Virtual Observatory>Chandra-Ed Archive Server.
3.In the new window that comes up, click "ObsID 115 - ACIS OBSERVATIONS OF TYCHO AND KEPLER". Do not close this window - it will be needed later.
4.When the image is loaded, go back to the SAOImage ds9 window.
Plot the spectrum of Tycho's SNR:
5.Click in the center of the Tycho SNR and drag a circular region completely around the whole remnant.
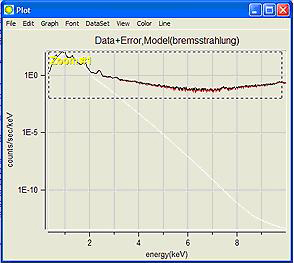
6.Choose Analysis>Chandra Ed>CIAO: Sherpa Spectral fit. For "Model Type", choose "bremsstrahlung" (click on "power law" and a menu will appear). It may take a few minutes for the plot to appear. NOTE: If this takes to long, the plot does not appear, try Analysis>Chandra Ed>Quick Energy Spectrum Plot. Note that the unit on the x-axis on this plot is eV rather than keV.
7.On the graph window that comes up, choose Graph>axes. and check Log under Ygrid. Maximize the screen by clicking the square in the upper right corner.
8.Printing the graph: On a PC, use the Print Scrn button on the keyboard and then paste it into a PowerPoint or Word document and print from there. On a Mac, open the application Grab (in Applications>Utilities and then Capture>Window and File>Print
Identify the emission lines in Tycho's SNR:
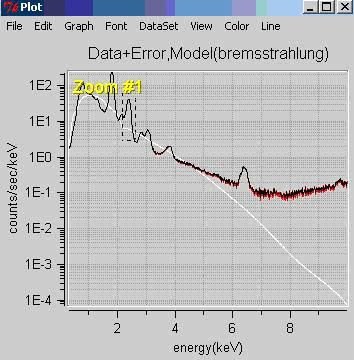
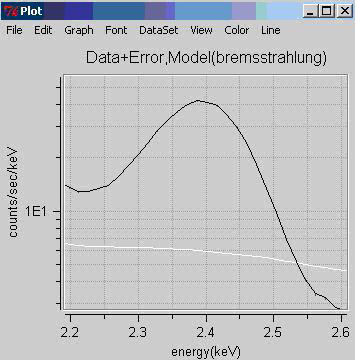
9.To get the energy of each emission line, create a zoom box on the graph by holding the left mouse button down and dragging a box around the area of the emission line (peak). Click again and a close-up of that area will appear. Right clicking the mouse returns you to the original graph. (See Figure 6)
Fig. 6 Zoom in on an emission line
10.Record the energies and identify the elements for each X-ray emission line/peak in the Data section and on your printed graph, using Table 1. If you have lines whose energy is not close to that of one of the elements in the chart, leave those lines unidentified.
Plot the spectrum of G292.0+1.8 and identify the emission lines:11. On the chandra-ed.cfa.harvard.edu window, click the back arrow to go back to the previous page. "Obs ID 126 - G292.0+1.8 A REMARKABLE OXYGEN-RICH SUPERNOVA REMNANT". Again, do not close this window.
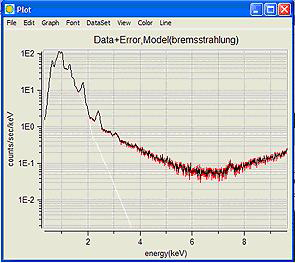
12. Repeat steps #4-10 for SNR G292.0+1.8. To see the emission lines better, you can zoom in as shown in Figure 7.
Fig. 7 Zoom to magnify emission lines
Table 1. Energies of X-ray Emission Lines
|
|
|
||||||||||||||||||||||||||||||||||||||||||||||||||||||||||||
|
|
|
Data:
| Tycho's SNR (Type Ia) | SNR G292.0+1.8 SNR (Type II) | ||||||||||||||||||||||||||||||||||||||||
|
|
Conclusions and Analysis:
1. What are the similarities and differences between these two spectra?
2. From your analysis of Tycho's SNR and SNR G292.0+1.8, what elements are more predominant in a Type Ia supernova? Which are more predominant in a Type II? Are there elements present in one that are not in another?
3. Explain how you might be able to classify a supernova event as type Ia or type II from its spectrum based on your observations of Tycho's SNR and SNR G292.0+1.8. Sometimes, due to interstellar absorption, emission lines less than 1.5 KeV are not seen. How could this affect your classification of a supernova remnant?
Extensions:
1. Analyze the spectra of any three of the following SNRs using the same procedure as Tycho's SNR and G292.0+1.8. Construct your own data tables.
- a. Obs ID 117 - ACIS OBSERVATIONS OF W49B
- b. Obs ID 116 - Kepler's SNR
- c. Obs ID 2758 - SNR 0103-72.6: AN UNSUALLY BRIGHT REMNANT IN THE SMC ALTERNATE TARGET
- d. Obs ID 775 - A SYSTEMATIC STUDY OF LMC SNRS WITH AXAF (this is the SNR called DEM L71)
- e. Obs ID 114 - ACIS OBSERVATIONS OF CAS A
2. From your analyses, classify these SNR by type. What is the basis for your conclusions? How sure are you of your classifications? What features of the spectra helped with your classifications? What features made it difficult to classify these SNR?
3. Look up these supernovas in the Chandra Supernova Photo Album. How do your results compare with the information in the Photo Album? http://chandra.harvard.edu/photo/category/snr.html


