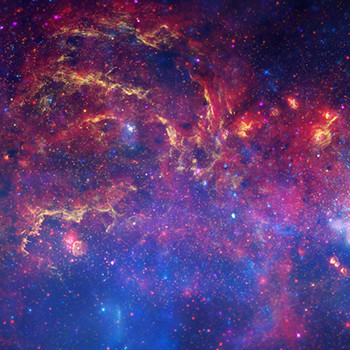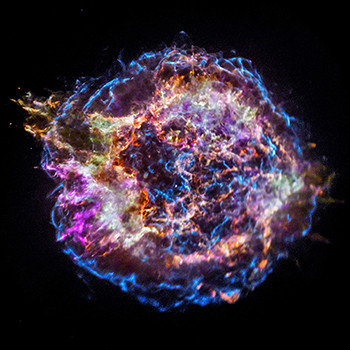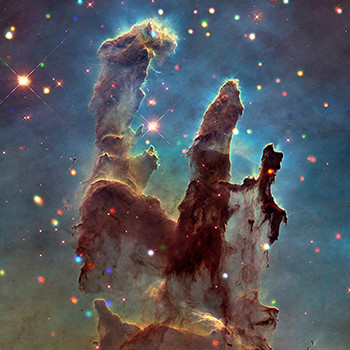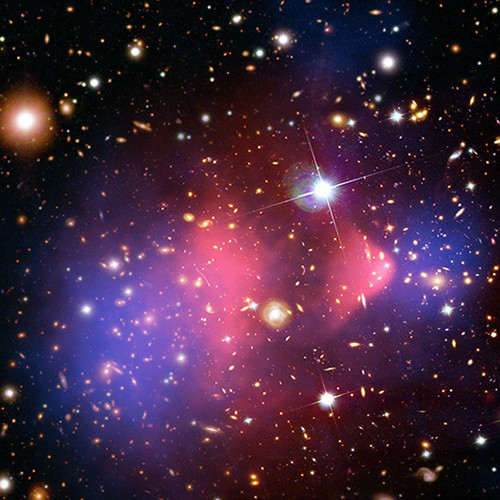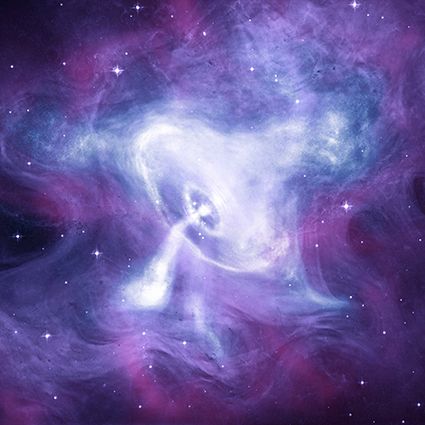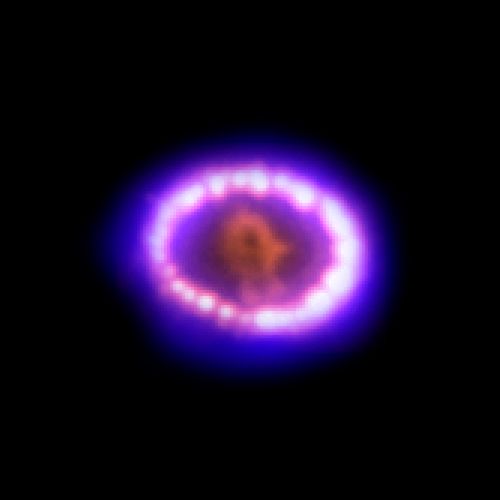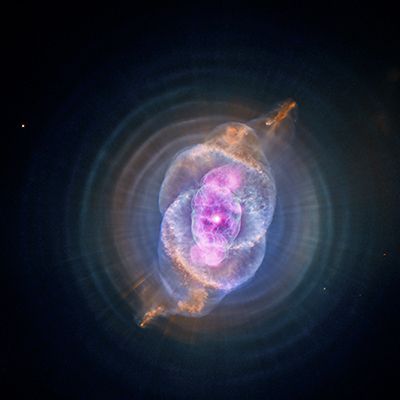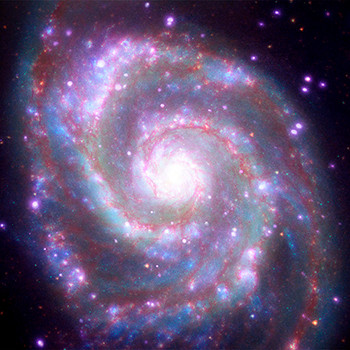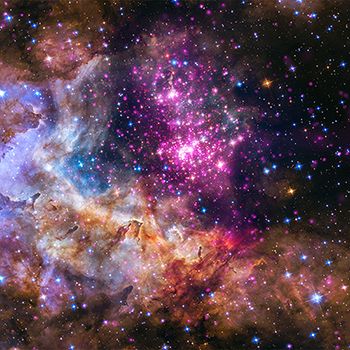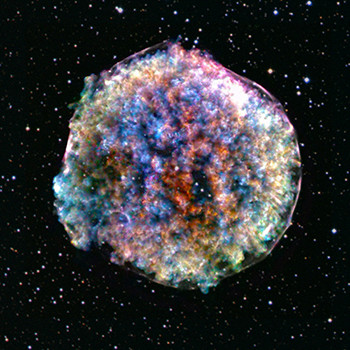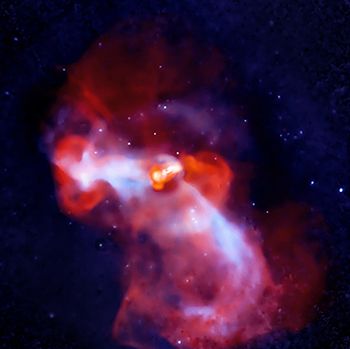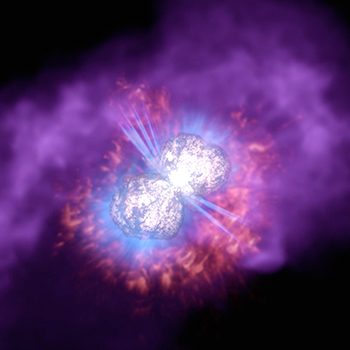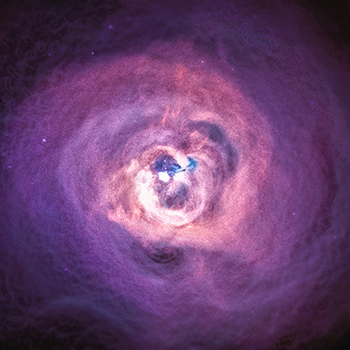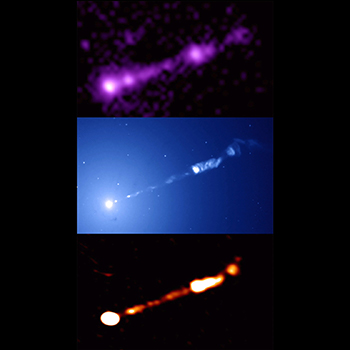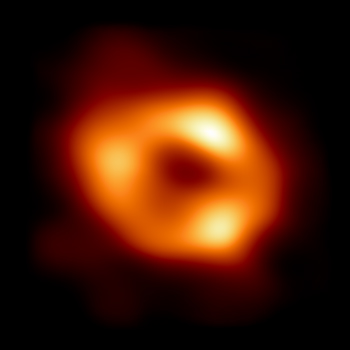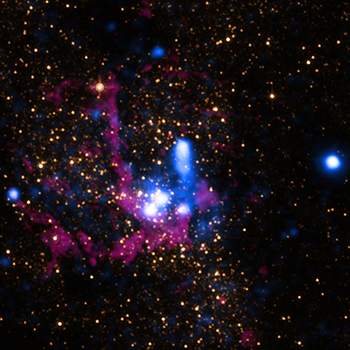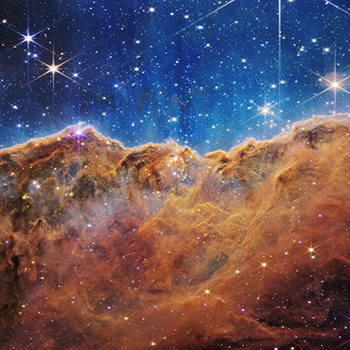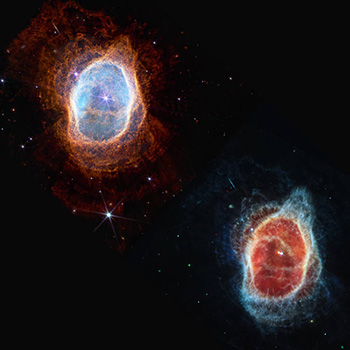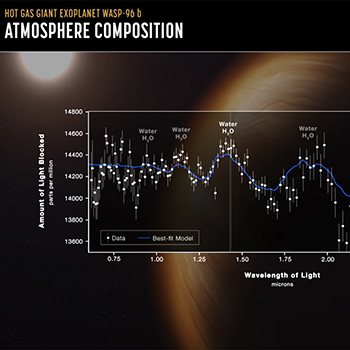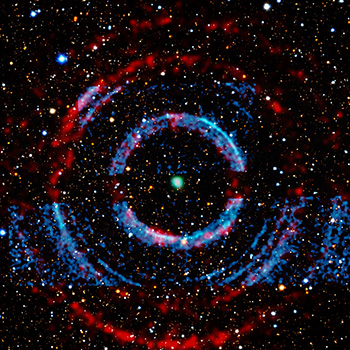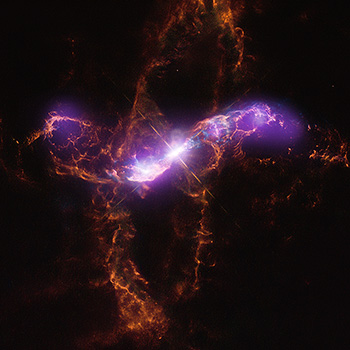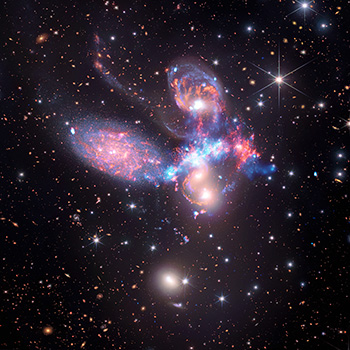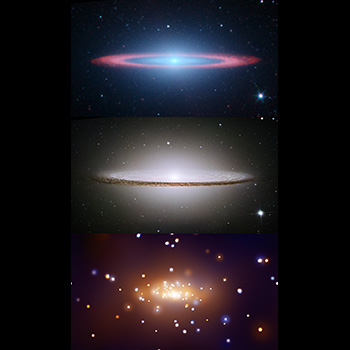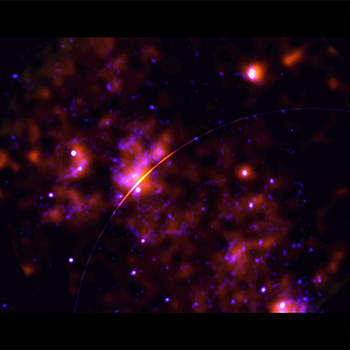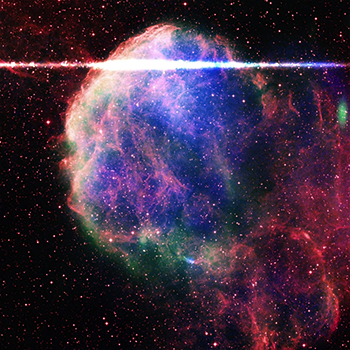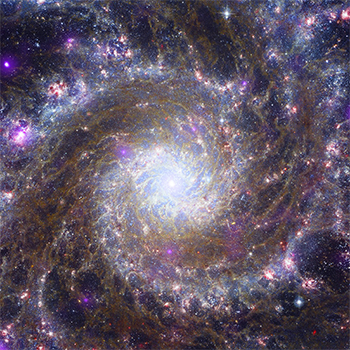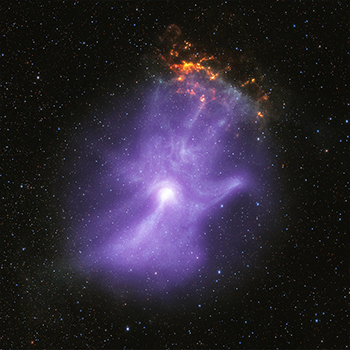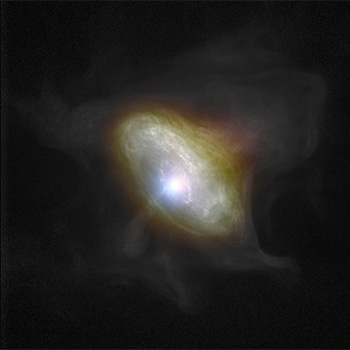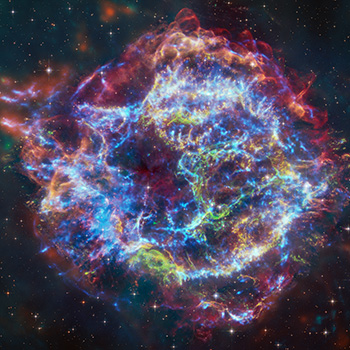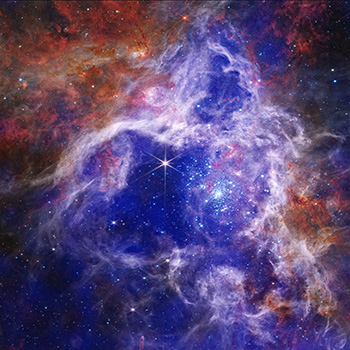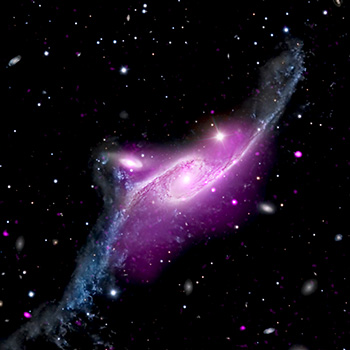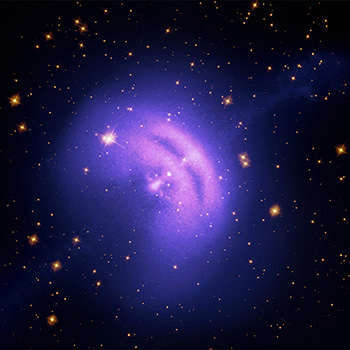
NASA is famous for beautiful space images, but did you know you can listen to them? Our universe is vast and mysterious, and many of us associate that expanse with imagery of stars and galaxies. Through listening to information about the universe translated into sound, people who are blind or low-vision can also share in those wonders. “Listen to the Universe,” a documentary for NASA’s free streaming platform NASA+, takes the audience behind the scenes with the team that creates NASA sonifications, translations of space data into sound. Galaxies, nebulae, planets and more take on new dimensions in these unique sound experiences.
The "Listen to the Universe" documentary originated on NASA+. Learn more about our sonifications at http://chandra.si.edu/sound
Listen to the Universe, audio only file: Listen to the Universe Visual Description
Listen to the Universe has won a dozen industry awards / recognition including "best of" awards from Raw Science Festival and the FEEDBACK festival; an Anthem Awards gold winner; official selections of Oxford Shorts, CYIFF, Redfish, LA Independent Women Film Awards; semifinalist of Seattle Film Festival and Flickers Rhode Island International Film Festival; a Communicator award of excellence; and a Webby Honoree.
Credits: NASA; Written, Directed & Produced by: Elizabeth Landau (NASA) Dr. Kimberly Arcand (NASA/CXC/SAO) April Jubett (NASA/CXC/SAO) Megan Watzke (NASA/CXC/SAO) Edited by: Ashlee Nichols Brookens (NASA) April Jubett (NASA/CXC/SAO). Featuring Christine Malec, Dr. Kimberly Arcand, Dr. Matt Russo, Andrew Santaguida, Dr. Wanda Diaz-Merced. Additional thanks to NASA, NASA+, Marshall Space Flight Center, Chandra/Smithsonian Astrophysical Observatory, and NASA's Universe of Learning.
More about Sonifications
A telescope like NASA's Chandra X-ray Observatory captures X-rays, which are invisible to the human eye, from sources across the cosmos. Similarly, NASA's James Webb Space Telescope captures infrared light, also invisible to the human eye. These different kinds of light are transmitted down to Earth, packed up in the form of ones and zeroes (binary code). From there, the data are transformed into a variety of formats for science — like plots, spectra, or images.
We can take that one step further and mathematically map the science imagery and data into sound. This data-driven process is not a reimagining of what the telescopes have observed; it is just another kind of translation. Explore our collection of data sonifications below.
What is this project?
In 2020, experts at the Chandra X-ray Center and System Sounds began the first ongoing, sustained program at NASA to “sonify” (turn into sound) astronomical data. Sonifications, being completely digital, are a valuable tool to work with our community partners.
Who is involved?
The project at the CXC is led by Dr. Kimberly Arcand, Chandra Visualization Scientist, and Dr. Matt Russo (astrophysicist/musician) and Andrew Santaguida (musician/sound engineer) at System Sounds. Consultant Christine Malec, an accessibility expert, podcaster and member of the blind community also joined the project.
How do you make sonifications?
We take actual observational data from telescopes like NASA’s Chandra X-ray Observatory, Hubble Space Telescope or James Webb Space Telescope and translate it into corresponding frequencies that can be heard by the human ear.
Are all of the sonifications the same?
No, each sonification is different in that we use different techniques based on the object and the data available. Read each caption to find out what process was done. Each sonification is created to best portray the scientific data in a way that makes the most sense for the specific data, keeping it accurately represented and telling the story, while also providing a new way of meaning-making through sound.
What have been the results of the project? Has it been successful?
Success can be measured in many ways, however from user testing of the sonifications with different audiences (from students to adults, and particularly blind or low vision participants), the response has been highly positive. Arcand ran a research study on sonifications with blind and sighted users, the results of which demonstrated high learning gains, enjoyment and wanting to know or learn more as well as strong emotional responses to the data.


