

A Star is Born
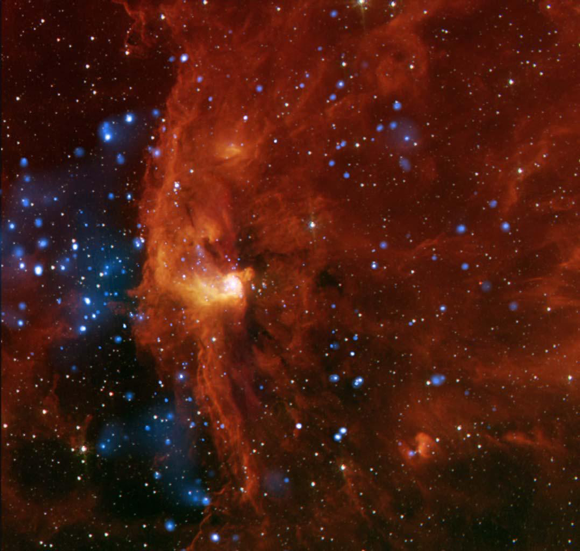
A star is born when a cloud of gas and dust collapses to the point where the material in the center of the clump is so dense and hot that the nuclear fusion of hydrogen nuclei into helium nuclei can occur. The outflow of energy released by these reactions provides the pressure necessary to halt the collapse. Note that the nuclear reactions inside stars are nuclear fusion reactions in which the nuclei of light elements are fused together to form heavier with the release of energy.
The brightest X-ray sources in our galaxy are the remnants of massive stars that have undergone a catastrophic collapseneutron stars and black holes. Other powerful sources of Xrays are supernova remnants - giant bubbles of hot gas produced by exploding stars. White dwarf stars and the hot, rarified outer layers, or coronas, of normal stars are less intense X-ray sources.
For a field guide to stellar evolution go to
chandra.harvard.edu/xray_sources/stars.html
The Hertzsprung-Russell (H-R) Diagram
There are a number of physical characteristics of stars that provide important information on the lives of stars, including mass and age and luminosity and temperature. The progress of a star's life is predestined by its mass, because ultimately the mass determines how much energy the star can produce and how quickly it will do so.
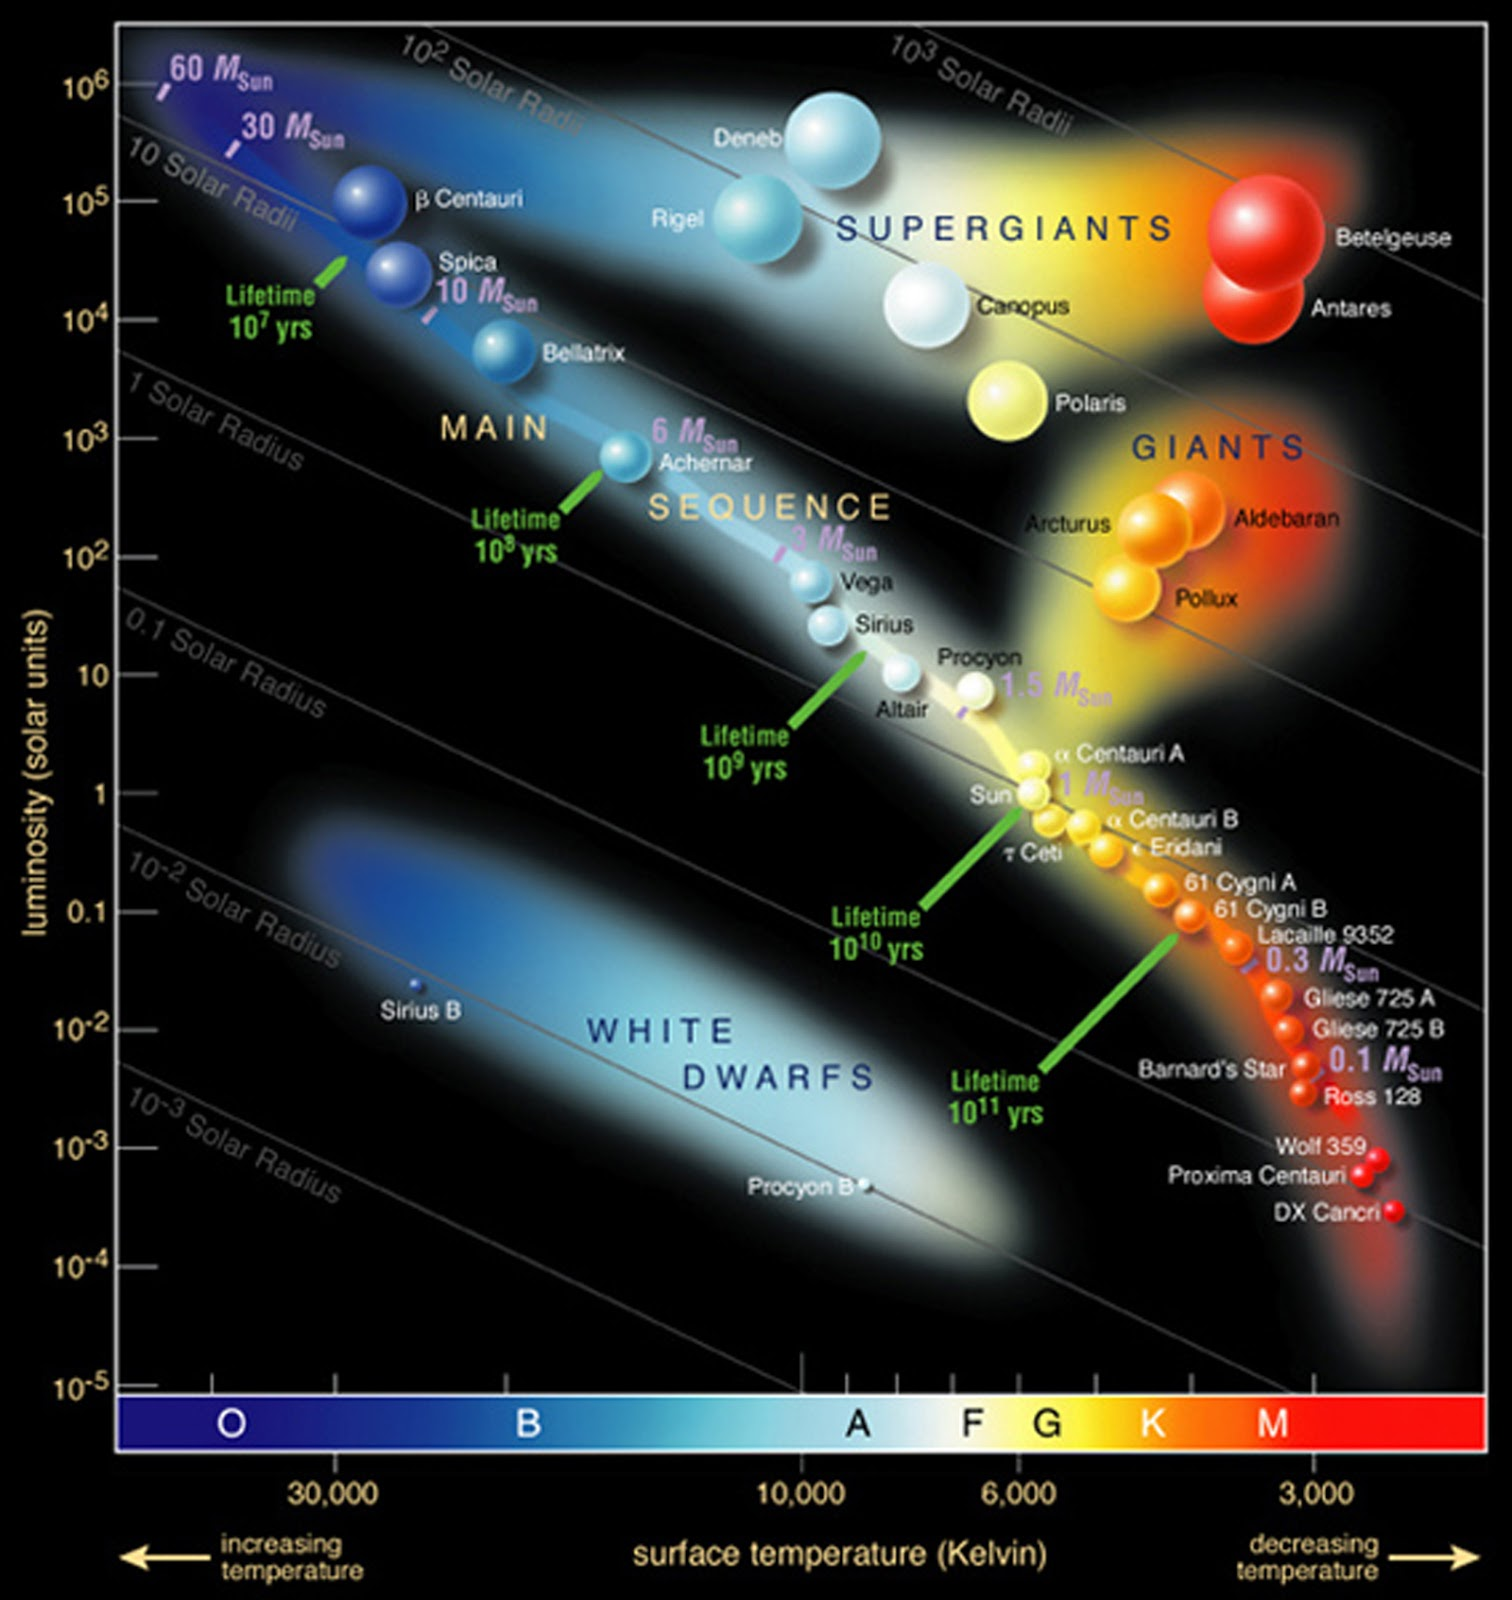
Two astronomers of the early 20th Century, Ejnar Hertzsprung and Henry Norris Russell, discovered an important observational means of comparing different stars with one another. They found that when you plot the brightnesses of individual stars versus their spectral type or color on a graph, the stars lie within well-defined areas within the graph. A star of a given brightness could only lie within a certain range of colors, and a star with a given color could only lie within a certain range of brightnesses. More observational and theoretical research showed that the color-magnitude diagram or Hertzsprung-Russell diagram was a snapshot of the evolutionary states of the stars plotted within the diagram. Stars would be found in different parts of the diagram depending upon their masses and their ages. As a star gets older, it changes in brightness and color in a very predictable way, and that stars of different masses change in very different ways.
Stars would be found in different parts of the diagram depending upon their masses and their ages. As a star gets older, it changes in brightness and color in a very predictable way, and that stars of different masses change in very different ways. From the location of a star on the graph, the luminosity, spectral type, color, temperature, mass, chemical composition, age, and evolutionary history are known. The Hertzsprung-Russell diagram, or H-R diagram, is the periodic table of the stars.
When we talk about stars, we often refer to them based upon their position in the H-R diagram. For example, we call stars that are still burning hydrogen in their cores main sequence stars, and will often refer to stars younger and older than main sequence stars as pre- and post-main sequence stars. Stars that have evolved well beyond the main sequence are often on the red giant branch of the H-R diagram, or might be asymptotic giant branch stars. All of these are stages of stars' lives, and the classifications help us to put them in context within the broader picture of stellar evolution.
Center for Astrophysics
60 Garden Street,
Cambridge, MA 02138 USA
cxcpub@cfa.harvard.edu
617-496-7941
Smithsonian Astrophysical Observatory, in Cambridge,
MA, with funding by NASA under contract NAS8-03060
Developed by the Chandra X-ray Center, at the Smithsonian Astrophysical Observatory, in Cambridge, MA, with funding by NASA under contract NAS8-03060 | Privacy | Accessibility


