How do Supermassive Black Holes Get Super Massive?
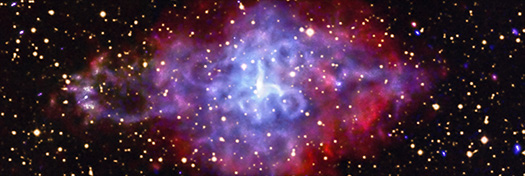
3C 58
Credit: X-ray: NASA/CXC/ICE-CSIC/A. Marino et al.; Optical: SDSS; Image Processing: NASA/CXC/SAO/J. Major
The supernova remnant 3C 58 contains a spinning neutron star, known as PSR J0205+6449, at its center. Astronomers studied this neutron star and others like it to probe the nature of matter inside these very dense objects. A new study, made using NASA’s Chandra X-ray Observatory and ESA’s XMM-Newton, reveals that the interiors of neutron stars may contain a type of ultra-dense matter not found anywhere else in the Universe.
In this image of 3C 58, low-energy X-rays are colored red, medium-energy X-rays are green, and the high-energy band of X-rays is shown in blue. The X-ray data have been combined with an optical image in yellow from the Digitized Sky Survey. The Chandra data show that the rapidly rotating neutron star (also known as a “pulsar”) at the center is surrounded by a torus of X-ray emission and a jet that extends for several light-years. The optical data shows stars in the field.
The team in this new study analyzed previously released data from neutron stars to determine the so-called equation of state. This refers to the basic properties of the neutron stars including the pressures and temperatures in different parts of their interiors.
The authors used machine learning, a type of artificial intelligence, to compare the data to different equations of state. Their results imply that a significant fraction of the equations of state — the ones that do not include the capability for rapid cooling at higher masses — can be ruled out.
The researchers capitalized on some neutron stars in the study being located in supernova remnants, including 3C 58. Since astronomers have age estimates of the supernova remnants, they also have the ages of the neutron stars that were created during the explosions that created both the remnants and the neutron stars. The astronomers found that the neutron star in 3C 58 and two others were much cooler than the rest of the neutron stars in the study.
The team thinks that part of the explanation for the rapid cooling is that these neutron stars are more massive than most of the rest. Because more massive neutron stars have more particles, special processes that cause neutron stars to cool more rapidly might be triggered.
One possibility for what is inside these neutron stars is a type of radioactive decay near their centers where neutrinos — low mass particles that easily travel through matter — carry away much of the energy and heat, causing rapid cooling.
Another possibility is that there are types of exotic matter found in the centers of these more rapidly cooling neutron stars.
The Nature Astronomy paper describing these results is available here. The authors of the paper are Alessio Marino (Institute of Space Sciences (ICE) in Barcelona, Spain), Clara Dehman (ICE), Konstantinos Kovlakas (ICE), Nanda Rea (ICE), J. A. Pons (University of Alicante in Spain), and Daniele Viganò (ICE).