Galactic Center Sonification
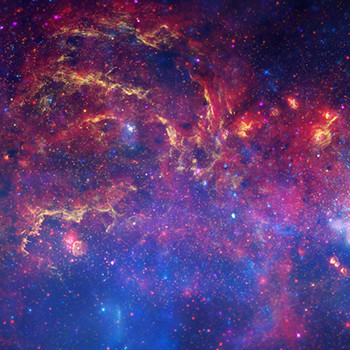
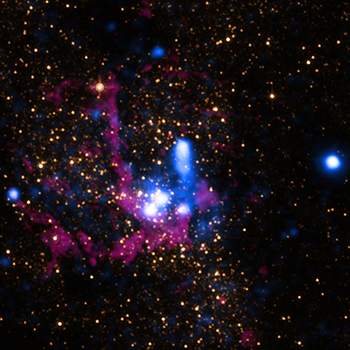
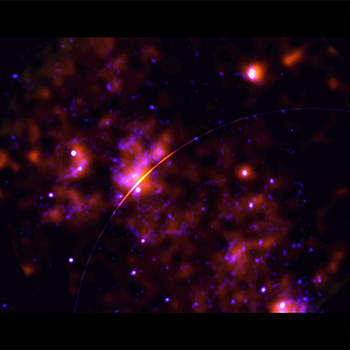
Explore the center of our very own Milky Way galaxy! The translation begins on the left side of the image and moves to the right, with the sounds representing the position and brightness of the sources. The light of objects located towards the top of the image are heard as higher pitches while the intensity of the light controls the volume. Stars and compact sources are converted to individual notes while extended clouds of gas and dust produce an evolving drone. The crescendo happens when we reach the bright region to the lower right of the image. This is where the 4-million-solar-mass supermassive black hole at the center of the Galaxy, known as Sagittarius A*, resides, and where the clouds of gas and dust are the brightest.
Users can listen to data from this region, roughly 400 light years across, either as "solos" from NASA's Chandra X-ray Observatory, Hubble Space Telescope, and Spitzer Space Telescope, or together as an ensemble in which each telescope plays a different instrument. Each image reveals different phenomena happening in this region about 26,000 light years from Earth. The Hubble image outlines energetic regions where stars are being born, while Spitzer's infrared data show glowing clouds of dust containing complex structures. X-rays from Chandra reveal gas heated to millions of degrees from stellar explosions and outflows from Sagittarius A*.
Access more information & file formats on this sonification
Cassiopeia A Sonification
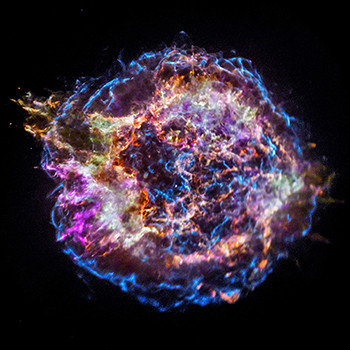
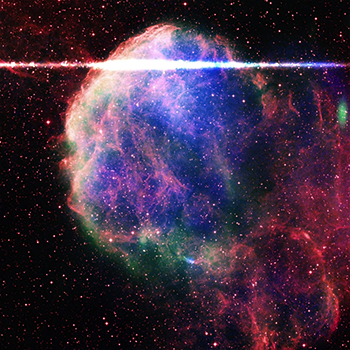
This sonified piece is of the remains of a supernova called Cassiopeia A, or Cas A. In Cas A, the sounds are mapped to four elements found in the debris from the exploded star as well as other high-energy data. The distribution of silicon, sulfur, calcium, and iron are revealed moving outward from the center of the remnant, starting from the location of the neutron star, in four different directions, with intensity again controlling the volume. There is also a fifth audio path moving along the upper left jet.
Access more information & file formats on this sonification
M16/Pillars of Creation Sonification
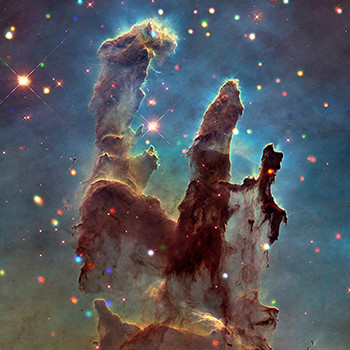
In the “Pillars of Creation” piece, the sounds are generated by moving horizontally across the image from left to right as seen in both optical and X-ray light. As with the sonification of the Galactic Center, the vertical position of the recorded light controls the pitch, but in this case it varies over a continuous range of pitches. Particular attention is paid to the structure of the pillars which can be heard as sweeps from low to high pitches and back. The two different "melodies" of optical and X-ray light can be enjoyed individually or simultaneously.
Access more information & file formats on this sonification
Bullet Cluster Sonification
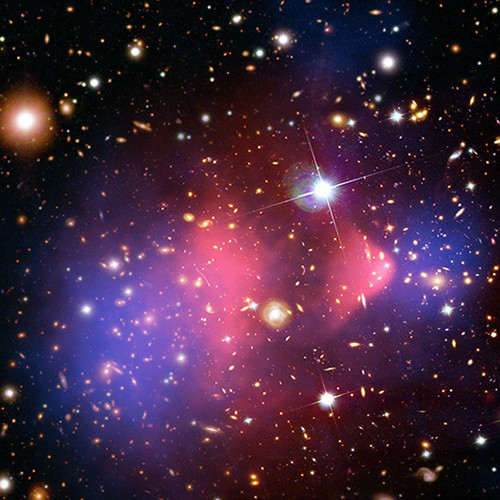
This image of the Bullet Cluster (officially known as 1E 0657-56) provided the first direct proof of dark matter, the mysterious unseen substance that makes up the vast majority of matter in the Universe. X-rays from Chandra (pink) show where the hot gas in two merging galaxy clusters has been wrenched away from dark matter, seen through a process known as “gravitational lensing” in data from Hubble (blue) and ground-based telescopes. In converting this into sound, the data pan left to right, and each layer of data was limited to a specific frequency range. Data showing dark matter are represented by the lowest frequencies, while X-rays are assigned to the highest frequencies. The galaxies in the image revealed by Hubble data, many of which are in the cluster, are in mid-range frequencies. Then, within each layer, the pitch is set to increase from the bottom of the image to the top so that objects towards the top produce higher tones.
Access more information & file formats on this sonification
Crab Nebula Sonification
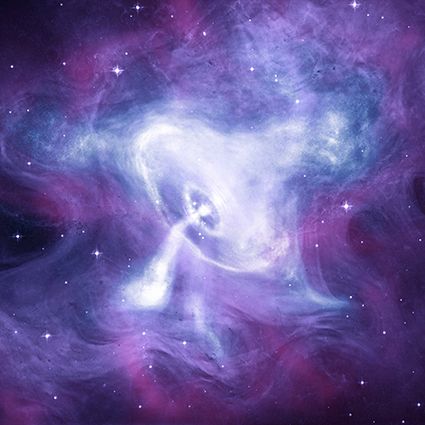
The Crab Nebula has been studied by people since it first appeared in Earth’s sky in 1054 A.D. Modern telescopes have captured its enduring engine powered by a quickly spinning neutron star that formed when a massive star collapsed. The combination of rapid rotation and a strong magnetic field generates jets of matter and anti-matter flowing away from its poles, and winds outward from its equator. For the translation of these data into sound, which also pans left to right, each wavelength of light has been paired with a different family of instruments. X-rays from Chandra (blue and white) are brass, optical light data from Hubble (purple) are strings, and infrared data from Spitzer (pink) can be heard in the woodwinds. In each case, light received towards the top of the image is played as higher pitched notes and brighter light is played louder.
Access more information & file formats on this sonification
SN87A Sonification
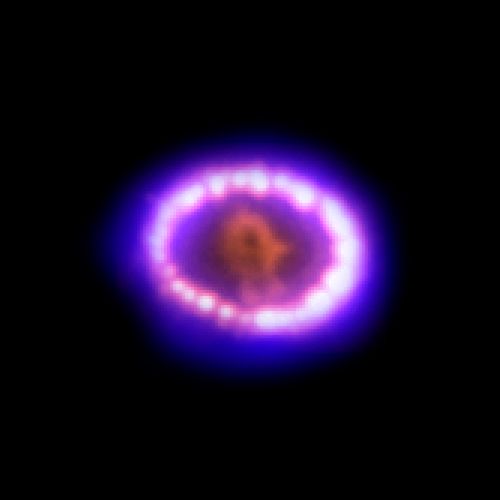
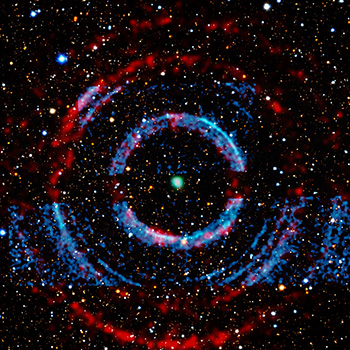
On February 24, 1987, observers in the southern hemisphere saw a new object in the Large Magellanic Cloud, a small satellite galaxy to the Milky Way. This was one of the brightest supernova explosions in centuries and soon became known as Supernova 1987A (SN 87A). This time lapse shows a series of Chandra (blue) and Hubble (orange and red) observations taken between 1999 and 2013. This shows a dense ring of gas, which was ejected by the star before it went supernova, begins to glow brighter as the supernova shockwave passes through. As the focus sweeps around the image, the data are converted into the sound of a crystal singing bowl, with brighter light being heard as higher and louder notes. The optical data are converted to a higher range of notes than the X-ray data so both wavelengths of light can be heard simultaneously. An interactive version lets the user play this astronomical instrument for themselves.
Access more information & file formats on this sonification
These sonifications of the Galactic Center, Cas A, M16, Bullet Cluster, Crab Nebula and SN1987a were led by the Chandra X-ray Center (CXC) as part of the NASA's Universe of Learning (UoL) program. The collaboration was driven by visualization scientist Dr. Kimberly Arcand (CXC), astrophysicist Dr. Matt Russo and musician Andrew Santaguida (both of the SYSTEM Sound project.)
NGC 6543 Sonification
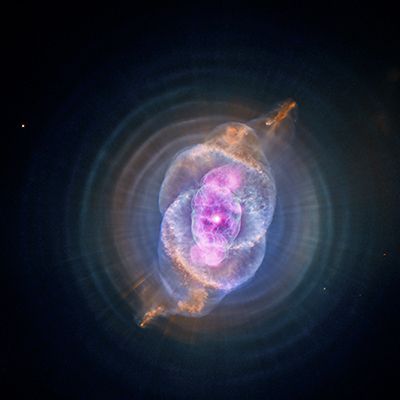
When a star like the Sun begins to run out of helium to burn, it will blow off huge clouds of gas and dust. These outbursts can form spectacular structures such as the one seen in the Cat’s Eye nebula. This image of the Cat’s Eye contains both X-rays from Chandra around the center and visible light data from the Hubble Space Telescope, which show the series of bubbles expelled by the star over time. To listen to these data, there is a radar-like scan that moves clockwise emanating from the center point to produce pitch. Light that is further from the center is heard as higher pitches while brighter light is louder. The X-rays are represented by a harsher sound, while the visible light data sound smoother. The circular rings create a constant hum, interrupted by a few sounds from spokes in the data. The rising and falling pitches that can be heard are due to the radar scan passing across the shells and jets in the nebula.
Access more information & file formats on this sonification
Chandra Deep Field Sonification
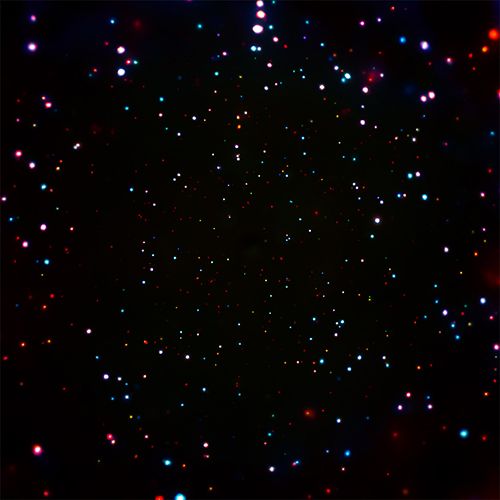
This is the deepest image ever taken in X-rays, representing over seven million seconds of Chandra observing time. For that reason, and because the observed field is in the southern hemisphere, astronomers call this region the “Chandra Deep Field South”. At first glance, this image may appear to be a view of stars. Rather, almost all these different colored dots are black holes or galaxies. Most of the former are supermassive black holes that reside at the centers of galaxies. In this data sonification, the colors dictate the tones as the bar moves from the bottom of the image to the top. More specifically, colors toward the red end of the rainbow are heard as low tones while colors towards purple are assigned to higher ones. Light that appears bright white in the image is heard as white noise. The wide range of musical frequencies represents the full range of X-ray frequencies collected by Chandra of this region. In the visual color image, this large frequency range in X-rays had to be compressed to be shown as red, green, and blue for low, medium, and high-energy X-rays. Played as sound, however, all of the data can be experienced. As the piece scans upward, the stereo position of the sounds can help distinguish the position of the sources from left to right.
Download
Access more information & file formats on this sonification
M51 Sonification
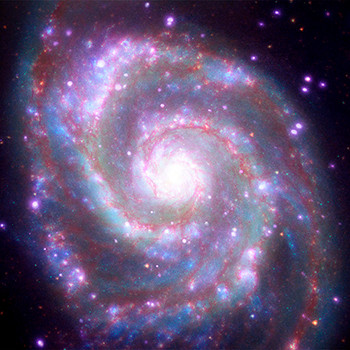
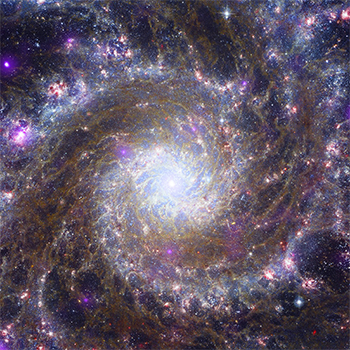
Messier 51 (M51) is perhaps better known by its nickname of the Whirlpool Galaxy because its face-on orientation to Earth reveals its wound-up spiral arms. This gives telescopes here a view of another spiral galaxy similar to our Milky Way, whose structure we cannot observe directly from our position within it. As with the Cat's Eye, the sonification begins at the top and moves radially around the image in a clockwise direction. The radius is mapped to notes of a melodic minor scale. Each wavelength of light in the image obtained from NASA telescopes in space (infrared, optical, ultraviolet, and X-ray) is assigned to a different frequency range. The sequence begins with sounds from all four types of light, but then separately moves through the data from Spitzer, Hubble, GALEX, and Chandra. At wavelengths in which the spiral arms are prominent, the pitches creep upwards as the spiral reaches farther from the core. A constant low hum associated with the bright core can be heard, punctuated by short sounds from compact sources of light within the galaxy.
Access more information & file formats on this sonification
Westerlund 2 Sonification
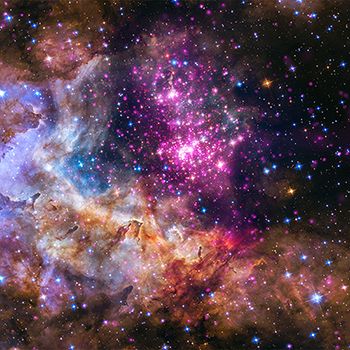
This is a cluster of young stars – about one to two million years old – located about
20,000 light-years from Earth. In its visual image form, data from Hubble (green and
blue) reveals thick clouds where stars are forming, while X-rays seen from Chandra
(purple) penetrate through that haze. In the sonified version of this data, sounds sweep
from left to right across the field of view with brighter light producing louder sound. The
pitch of the notes indicates the vertical position of the sources in the image with the
higher pitches towards the top of the image. The Hubble data is played by strings, either
plucked for individual stars or bowed for diffuse clouds. Chandra’s X-ray data is represented by bells, and the more diffuse X-ray light is played by more sustained tones.
Access more information & file formats on this sonification
Tycho Sonification
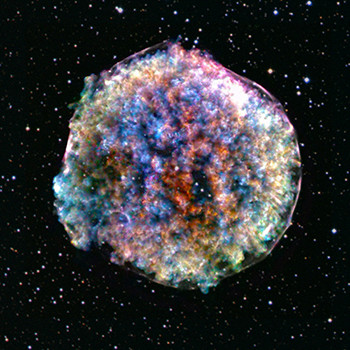
Beginning in the center, the sonification of the Tycho supernova remnant expands outward in a circle. The image contains X-ray data from Chandra where the various colors represent small bands of frequency that are associated with different elements that are moving both toward and away from Earth. For example, red shows iron, green is silicon, and blue represents sulfur. The sonification aligns with those colors as the redder light produces the lowest notes and blue and violet create the higher-pitched notes. Color varies over the remnant, but the lowest and highest notes (red and blue) dominate near the center and are joined by other colors (mid-range notes) towards the edge of the remnant. White corresponds to the full range of frequencies of light observable by Chandra, which is strongest toward the edge of the remnant. This light is converted to sound in a more direct way as well, by interpreting frequencies of light as frequencies of sound and then shifting them lower by 50 octaves so that they fall within the human hearing range. The different proportions of iron, silicon, and sulfur across the remnant can be heard in the changing amounts of the low-, mid-, and high-frequency peaks in the sound. The field of stars in the image as observed by Hubble is played as notes on a harp with the pitch determined by their color.
Access more information & file formats on this sonification
M87 Sonification
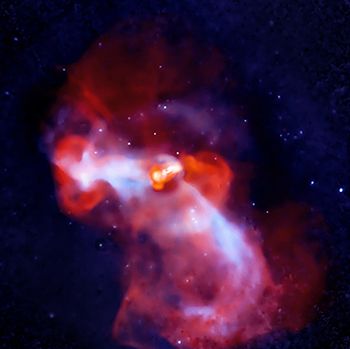
The giant black hole in Messier 87 (M87 for short) and its surroundings have been studied for many years and by a range of telescopes including Chandra (blue) and the Very Large Array (red and orange). This data shows that the black hole in M87 is sending out massive jets of energetic particles that interact with vast clouds of hot gas that surround it. To translate the X-rays and radio waves into sound, the image is scanned beginning at the 3 o’clock position and sweeping clockwise like a radar. Light farther from the center is heard as higher pitched while brighter light is louder. The radio data are lower pitched than the X-rays, corresponding to their frequency ranges in the electromagnetic spectrum. The point-like sources in X-ray light, most of which represent stars in orbit around a black hole or neutron star, are played as short, plucked sounds.
Access more information & file formats on this sonification
Eta Carinae Sonification
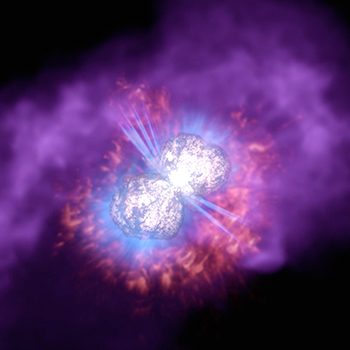
Massive stars are known to have major outbursts. Eta Car, one of the most massive stars known, expelled about 10% of its mass in the Great Eruption, creating a small nebula, called the Homunculus Nebula, around it. Data captured in different wavelengths of light reveal different structures, each providing more information about the outbursts of Eta Car. This sonification translates the three-dimensional model of Eta Carinae as it spins around in the center. Data from NASA's Hubble Space Telescope are played first, with optical light followed by ultraviolet light, before moving to emission from hydrogen atoms, and then finally X-rays from Chandra. Each type of light is layered into the one before it, until the last piece of the sonification becomes a chorus of light and sound.
Download
Access more information on this sonification
Perseus Cluster Sonification
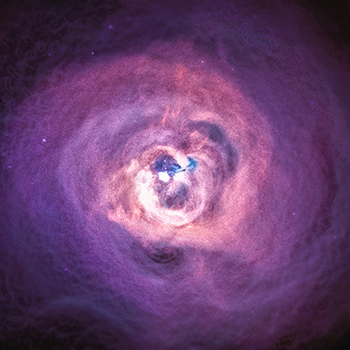
Since 2003, the black hole at the center of the Perseus galaxy cluster has been associated with sound. This is because astronomers discovered that pressure waves sent out by the black hole caused ripples in the cluster's hot gas that could be translated into a note — one that humans cannot hear some 57 octaves below middle C. Now a new sonification brings more notes to this black hole sound machine. In some ways, this sonification is unlike any other done before because it revisits the actual sound waves discovered in data from NASA's Chandra X-ray Observatory. The popular misconception that there is no sound in space originates with the fact that most of space is essentially a vacuum, providing no medium for sound waves to propagate through. A galaxy cluster, on the other hand, has copious amounts of gas that envelop the hundreds or even thousands of galaxies within it, providing a medium for the sound waves to travel. In this sonification of Perseus, the sound waves astronomers previously identified were extracted and made audible for the first time. The sound waves were extracted in radial directions, that is, outwards from the center. The signals were then resynthesized into the range of human hearing by scaling them upward by 57 and 58 octaves above their true pitch. Another way to put this is that they are being heard 144 quadrillion and 288 quadrillion times higher than their original frequency. (A quadrillion is 1,000,000,000,000,000.) The radar-like scan around the image allows you to hear waves emitted in different directions. In the visual image of these data, blue and purple both show X-ray data captured by Chandra.
Download
Access more information on this sonification
M87 Jet Sonification
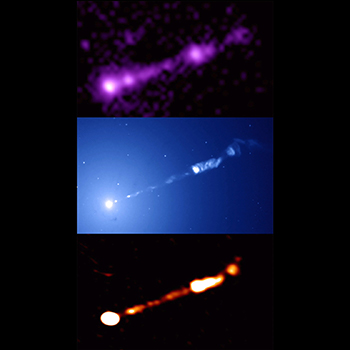
Studied by scientists for decades, the black hole in Messier 87, or M87, gained celebrity status in science after the first release from the Event Horizon Telescope (EHT) project in 2019. This sonification does not feature the EHT data, but rather looks at data from other telescopes that observed M87 on much wider scales at roughly the same time. The image in visual form contains three panels that are, from top to bottom, X-rays from Chandra, optical light from NASA's Hubble Space Telescope, and radio waves from the Atacama Large Millimeter Array in Chile. The brightest region on the left of the image is where the black hole is found, and the structure to the upper right is a jet produced by the black hole. The jet is produced by material falling onto the black hole. The sonification scans across the three-tiered image from left to right, with each wavelength mapped to a different range of audible tones. Radio waves are mapped to the lowest tones, optical data to medium tones, and X-rays detected by Chandra to the highest tones. The brightest part of the image corresponds to the loudest portion of the sonification, which is where astronomers find the 6.5-billion solar mass black hole that EHT imaged.
Download
Access more information on this sonification
Sagittarius A* (Event Horizon Telescope Image)
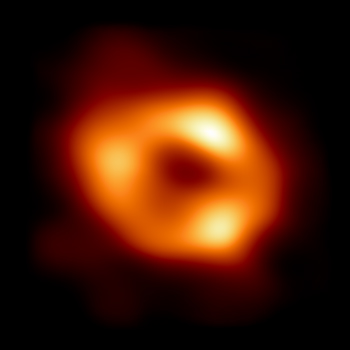
This is a sonification — translation into sound — of the latest image from the Event Horizon Telescope of the supermassive black hole at the center of the Milky Way called Sagittarius A* (Sgr A*). Using a radar-like scan, the sonification begins at the 12 o'clock position and sweeps clockwise. Changes in volume represent the differences in brightness the EHT observed around the event horizon of Sgr A*. The material that is closer to the black hole and hence moving faster corresponds to higher frequencies of sound. This sonification was processed in a special way to allow a listener to hear the data in 3D stereo sound, in which the sounds seem to start directly ahead and then move clockwise to one ear then the other as the sweep is made.
Download
Access more information on this sonification
Sagittarius A*
This image shows the region around the Milky Way's central supermassive black hole, known as Sagittarius A* (Sgr A*), in infrared (orange and purple) and X-ray light (blue). The image is scanned from left to right and the data are transformed into sound. The brightness of the objects is represented by the volume, while the vertical positions of the sources in the image are mapped to musical pitches. X-rays are played with a soft synthesizer and the infrared data are heard as bass notes and plucked sounds. The brightest region in the middle of the image (and hence the loudest) is where Sgr A* the black hole, resides. It is within this area that the Event Horizon Telescope was able to peer to obtain the first image of Sgr A* itself.
Access more information & file formats on this sonification
Carina Nebula
Video Description:
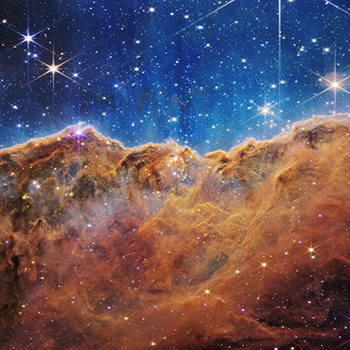
Sonifications map a near-infrared image of the Cosmic Cliffs in the Carina Nebula, captured by NASA’s Webb Telescope, to a symphony of sounds. Musicians assigned unique notes to the semi-transparent, gauzy regions and very dense areas of gas and dust in the nebula, culminating in a buzzing soundscape.
The sonification scans the image from left to right. The new sounds were also adapted to a video, allowing sighted viewers to watch as a vertical line moves across the frame.
The soundtrack is vibrant and full, representing the detail in this gigantic, gaseous cavity that has the appearance of a mountain range. The Carina Nebula is a large cloud of gas and dust where stars are forming or have already formed.
The gas and dust in the top half of the image are represented in blue hues and windy, drone-like sounds. The bottom half of the image, represented in ruddy shades of orange and red, has a clearer, more melodic composition.
Brighter light in the image is louder. The vertical position of light also dictates the frequency of sound. For example, bright light near the top of the image sounds loud and high, but bright light near the middle is loud and lower pitched. Dimmer, dust-obscured areas that appear lower in the image are represented by lower frequencies and clearer, undistorted notes.
The separate tracks below more easily pick out the meandering melodic line that represents the nebula’s “mountain range” as it rises and falls in the image, through the center of the frame, from left to right. This jagged line between denser and thinner areas of gas and dust is the arc of the sonification’s melody. All stars are represented by a combination of pitches and processed piano notes, but the brightest stars with longer diffraction spikes also carry crashes and clangs from cymbals.
Several files appear below for download: The first represents the entire image. The second only includes sounds from the top portion of the image, and the third file only includes sounds from the bottom half of the image. Listen to the second and third files to discern the “mountain top” feature in the image. A fourth file only plays the notes that represent stars. Listen to all of the tracks for a more complex understanding of how sounds were adapted to Webb’s image of the Cosmic Cliffs.
This sonification does not represent sounds recorded in space. Two musicians mapped the telescope’s data to sound, carefully composing music to accurately represent details the team would like listeners to focus on. In a way, this sonification is like modern dance or an impressionist painting — it converts Webb’s image to a new medium to engage and inspire listeners.
Explore Webb’s image of the Cosmic Cliffs, including its full text description, in more detail.
Access more information & file formats on this sonification
Southern Ring Nebula
Video Description:
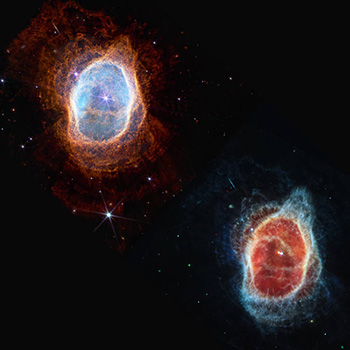
NASA’s Webb Telescope uncovered two views of the Southern Ring Nebula — in near-infrared light (at left) and mid-infrared light (at right) — and each has been adapted to sound.
Two stars orbit one another at the center of this planetary nebula. The smaller, fainter red star in the mid-infrared image at right is at the end of its lifetime — it has puffed off layers of gas and dust for thousands of years. Its companion, the brighter, larger star in both images, has stirred up those ejections. Now, listeners can hear the stars and surrounding shells of material in each image clearly.
In this sonification, the colors in the images were mapped to pitches of sound — frequencies of light converted directly to frequencies of sound. Near-infrared light is represented by a higher range of frequencies at the beginning of the track. Mid-way through, the notes change, becoming lower overall to reflect that mid-infrared includes longer wavelengths of light.
Listen carefully at 15 seconds and 44 seconds. These notes align with the centers of the near- and mid-infrared images, where the stars at the center of the “action” appear. In the near-infrared image that begins the track, only one star is heard clearly, with a louder clang. In the second half of the track, listeners will hear a low note just before a higher note, which denotes that two stars were detected in mid-infrared light. The lower note represents the redder star that created this nebula, and the second is the star that appears brighter and larger.
This sonification does not represent sounds recorded in space. Two musicians mapped the telescope’s data to sound, carefully composing music that represents near- and mid-infrared light, specifically to hear their contrasts. In a way, this sonification is like modern dance or an abstract painting — it converts two of Webb’s images into a new medium to engage and inspire listeners.
Explore Webb’s image of the Southern Ring Nebula, including its full text description, in more detail.
Access more information & file formats on this sonification
WASP-96 b
Video Description:
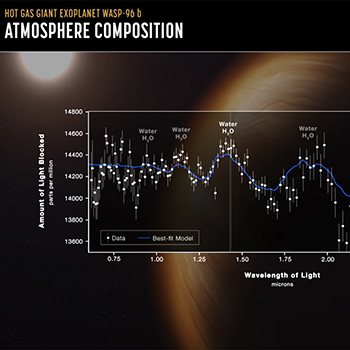
NASA’s Webb Telescope observed the atmospheric characteristics of the hot gas giant exoplanet WASP-96 b — which contains clear signatures of water — and the resulting transmission spectrum’s individual data points were translated into sound.
The sonification scans the spectrum from left to right. From bottom to top, the y-axis ranges from less to more light blocked. The x-axis ranges from 0.6 microns on the left to 2.8 microns on the right. The pitches of each data point correspond to the frequencies of light each point represents. Longer wavelengths of light have lower frequencies and are heard as lower pitches. The volume indicates the amount of light detected in each data point. The new sounds were also adapted to a video, allowing sighted viewers to watch the progression as the vertical line moves across the graph, ringing out a musical note for each data point.
The four water signatures are represented by the sound of water droplets falling. These sounds simplify the data — water is detected as a signature that has multiple data points. The sounds align only to the highest points in the data.
This sonification does not represent sounds recorded in space. Two musicians converted Webb’s transmission spectrum to musical pitches to help listeners hear its data.
Explore Webb’s transmission spectrum of hot gas giant exoplanet WASP-96 b in more detail, including its full text description and data download.
Download
Access more information on this sonification
The Chandra sonifications were led by the Chandra X-ray Center (CXC), with input from NASA's Universe of Learning. The sustained collaboration was driven by visualization scientist Dr. Kimberly Arcand (CXC), astrophysicist Dr. Matt Russo and musician Andrew Santaguida (both of the SYSTEM Sounds project). For other sonifications, please see their linked pages.
Resources
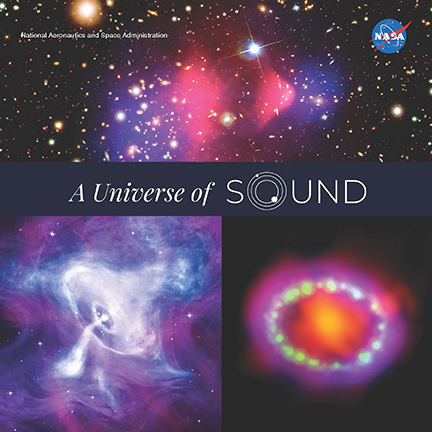
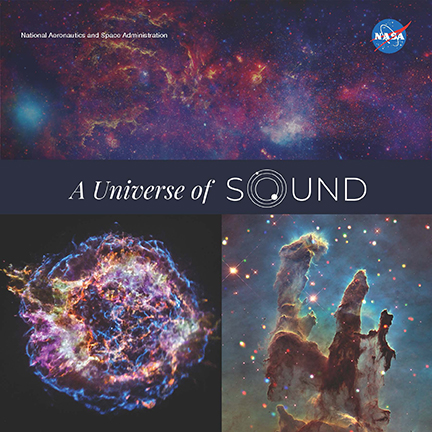
A Universe of Sound (Trailer)