

CXC Home | Search | Help | Image Use Policy | Latest Images | Privacy | Accessibility | Glossary | Q&A
1
Logarithmic Scale
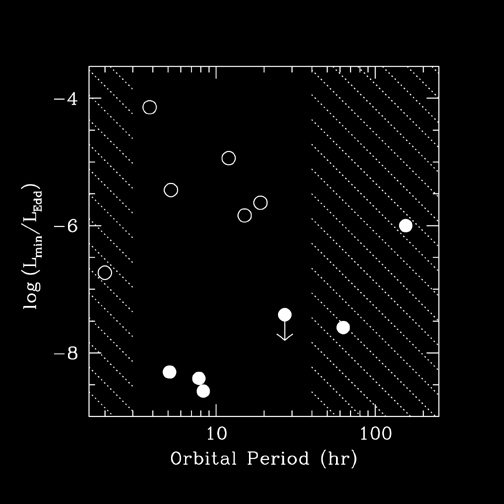
The luminosities of six dormant X-ray novas containing black holes, as measured by Chandra, are compared to the luminosities of six dormant X-ray novas containing neutron stars. The black holes are represented as filled circles and the neutron stars as open circles. The vertical axis is the logarithm of the dormant luminosity in Eddington scaled units (which are the natural units to use for the luminosity). The arrow indicates that one black hole system has not yet been detected, but is fainter than the point indicated on the graph. The horizontal axis gives the orbital period of the binary systems. The amount of energy and matter being accreted onto the neutron star or black hole increases with increasing orbital period, so we expect those systems with the longest periods to be the most luminous. For this same reason, in order to make an unbiased comparison of the luminosities of black holes and neutron star systems, one should compare systems with similar orbital periods. The non-shaded area highlights a region on the graph where the black hole and neutron star systems have similar orbital periods.
Within this region, it is clear that the black hole systems are 100 to 1000 times fainter than the neutron star systems. Given that the amount of energy and matter being accreted is similar in both cases, the much lower luminosity of the black hole systems indicates that they are 'hiding' the accretion energy behind an event horizon.
(Credit: NASA/CfA/M. Garcia et al.)
2
Linear Scale
The objects within the non-shaded area on the logarithmic plot are shown here on a linear scale. Here we see luminosities of four dormant X-ray nova containing black holes, as measured by Chandra, compared to the luminosities of five dormant X-ray nova containing neutron stars. The black holes are represented as filled circles, and the neutron stars as open circles. The vertical axis is the luminosity in Eddington units, scaled so that the luminosity of the black holes is about 1 (Eddington units are the natural units to use for the luminosity). The horizontal axis gives the orbital period of the binary systems. the arrows indicate that the luminosity is lower (for one black hole system) or higher (for four neutron star systems) than their respective points indicated on the graph.
It is clear from this graph that the black hole systems are at least 100 times fainter than the neutron star systems. Given that the amount of energy and matter being accreted is similar in both cases, the much lower luminosity of the black hole systems indicates that they have an event horizon which hides more than 99% of their accretion luminosity.
(Credit: NASA/CfA/M. Garcia et al.)
Return to Black Holes (11 Jan 01)
Revised: May 17, 2022