Astronomers Take the Measure of Dark Matter in universe
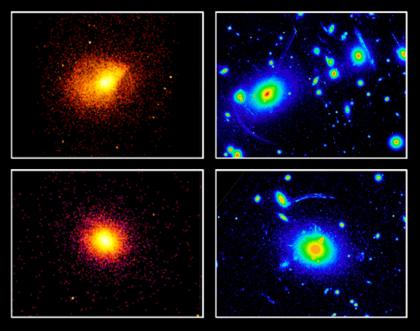
This montage shows two sets of Chandra X-ray Observatory images (left) and Hubble Space Telescope images (right) of the giant galaxy clusters Abell 2390 and MS2137.3-2353. The clusters are located 2.5 and 3.1billion light years from Earth respectively. The X-ray emission comes from the multimillion-degree gas that fills the clusters. Chandra provides detailed temperature maps for this gas and allows astronomers to precisely determine the masses of the clusters. Most of the mass is in the form of dark matter.
The Hubble Space Telescope optical images show the distribution of galaxies in the central regions of the clusters. The gravity of the dark matter associated with the brightest galaxies in the clusters and the cluster as a whole bends light from distant background galaxies to produce the giant arcs seen in the images. The Hubble Space Telescope data place independent constraints on the masses of the clusters that confirm the Chandra results.
| ||||||||||||


