
CXC Home | Search | Help | Image Use Policy | Latest Images | Privacy | Accessibility | Glossary | Q&A
1
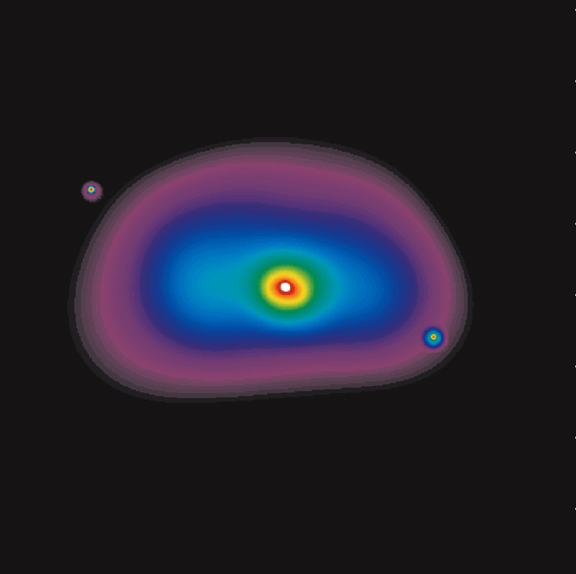
Lower-energy X-ray image
This Chandra image shows NGC 1700 as it appears in the wavelength range of 0.3 through 0.8 keV.
Credit: NASA/Ohio U./T.Statler et al.
This Chandra image shows NGC 1700 as it appears in the wavelength range of 0.3 through 0.8 keV.
Credit: NASA/Ohio U./T.Statler et al.
2
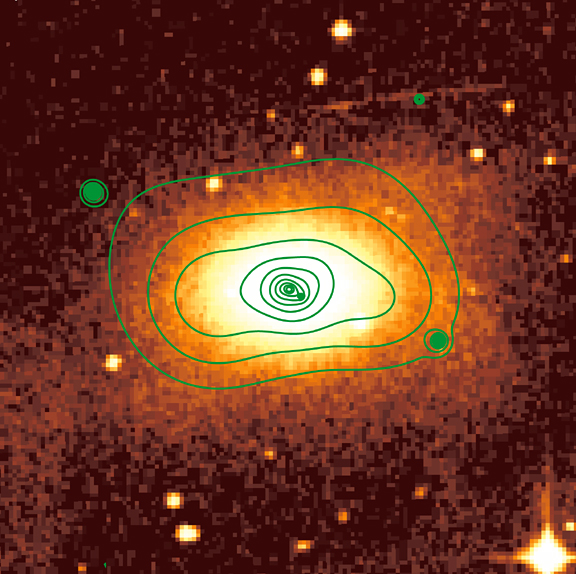
Optical image with X-ray
contours
In this figure, contours of the Chandra X-ray data are overlaid on an optical image taken by the Digital Sky Survey. The apparent structure along the left edge and the streak to the upper right of the galaxy are plate defects, but the boxy structure of the galaxy is real.
Credit: Optical(DSS), X-ray (NASA/Ohio U./T.Statler et al.)
3
Return to NGC 1700 (18 Dec 02)
Revised: July 09, 2008