

CXC Home | Search | Help | Image Use Policy | Latest Images | Privacy | Accessibility | Glossary | Q&A
1
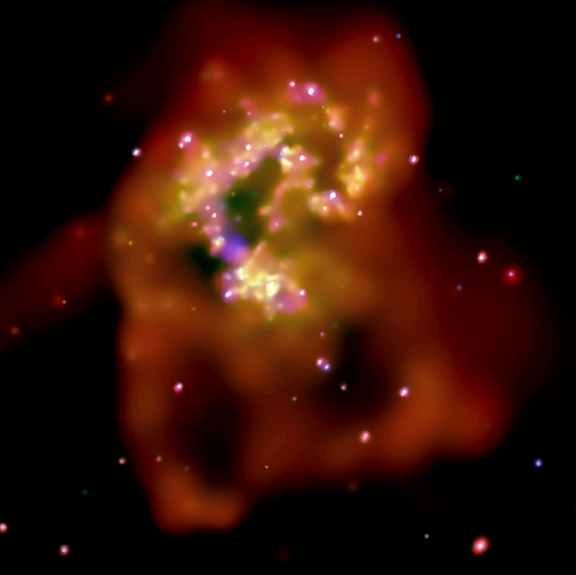
Chandra X-ray Image of The Antennae
This Chandra image is a wide-field X-ray view of The Antennae. It reveals spectacular loops of hot gas spreading out from the southern part of The Antennae into intergalactic space. Also shown are huge clouds of multimillion degree gas and bright point like sources due to neutron stars and black holes. The image is color coded so that low, medium and high energy X-rays appear as red, green and blue, respectively.
Scale: Image is 4.8 arcmin per side.
(Credit: NASA/CXC/SAO/G. Fabbiano et al.)
2
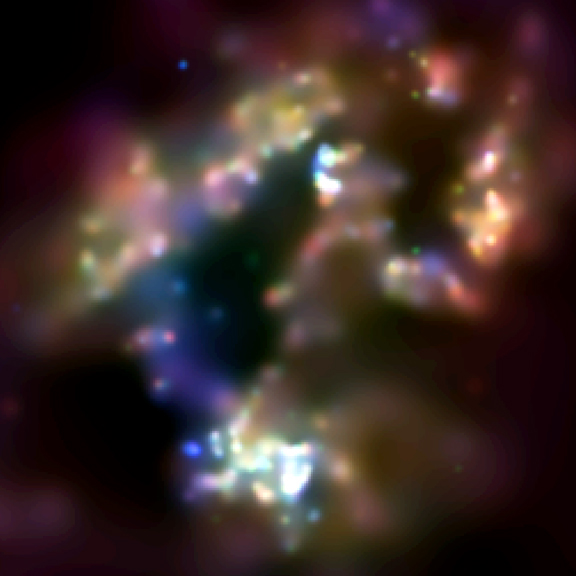
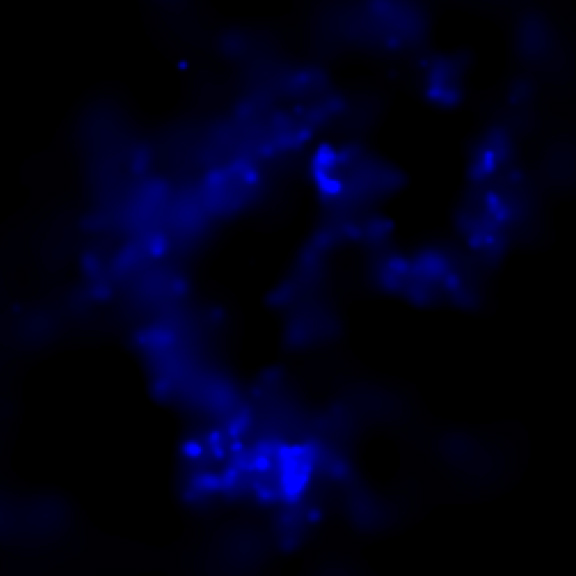
Chandra Image of Diffuse Emission
This X-ray image has been processed to minimize the point sources in the Chandra observations of The Antennae galaxies. The result is that the clouds of multimillion-degree gas in the system are clearly revealed. The colors in this image show the intensity of the low (red), medium (green) and high (blue) energy X-rays.
Scale: Image is 2 arcmin per side.
(Credit: NASA/CXC/SAO/G. Fabbiano et al.)
3
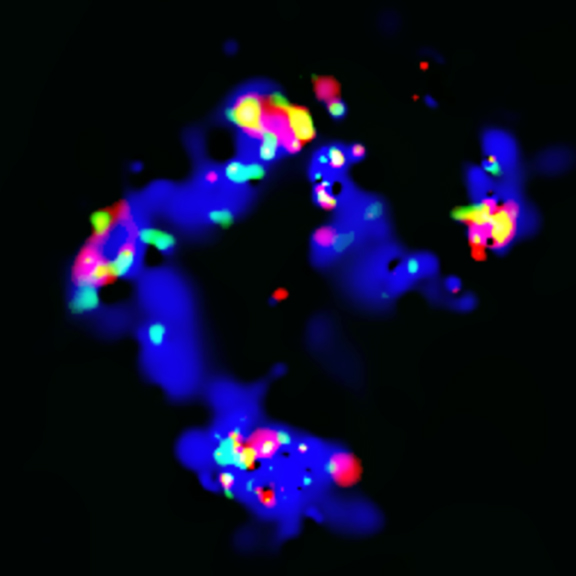
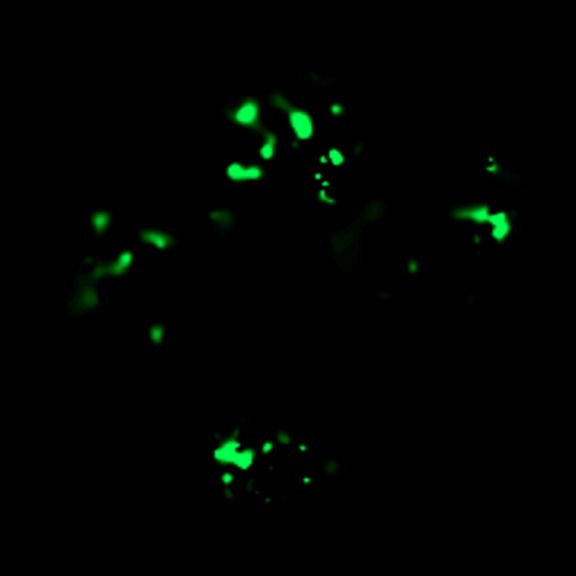
Composite Abundance Map
This image is a composite of three maps tracing the abundances of elements found in The Antennae system. These elements are coded so that iron appears as red, magnesium as green, and silicon as blue.
Scale: Image is 2 arcmin per side.
(Credit: NASA/CXC/SAO/G. Fabbiano et al.)
This image is a composite of three maps tracing the abundances of elements found in The Antennae system. These elements are coded so that iron appears as red, magnesium as green, and silicon as blue.
Scale: Image is 2 arcmin per side.
(Credit: NASA/CXC/SAO/G. Fabbiano et al.)
4
5
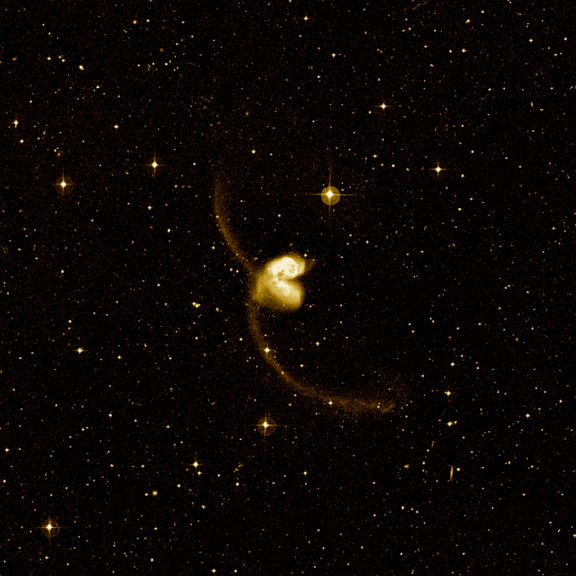
Wide-field Optical Image
This visible light image is a wide-field look at the region surrounding the pair of colliding galaxies known as The Antennae.
Scale: Image is 36 arcmin per side.
(Credit: Digitized Sky Survey)
This visible light image is a wide-field look at the region surrounding the pair of colliding galaxies known as The Antennae.
Scale: Image is 36 arcmin per side.
(Credit: Digitized Sky Survey)
6
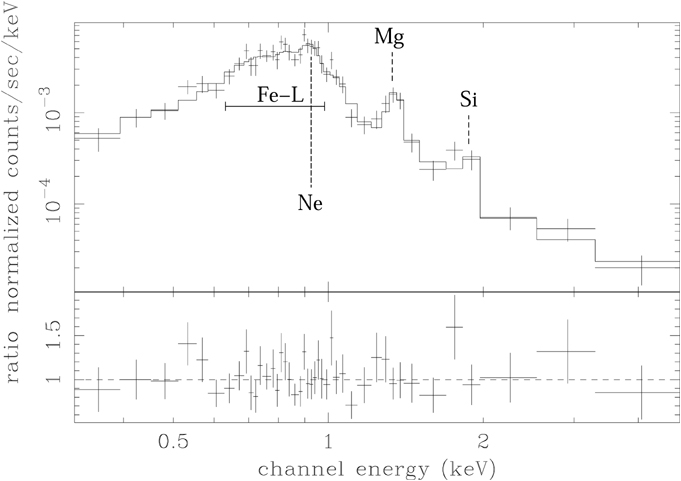
Spectrum of Region in Antennae
This is a spectrum of a region in The Antennae galaxies that shows the physical signatures of elements of iron (Fe), magnesium (Mg), and silicon (Si). Spectroscopy is the study of how different atoms absorb and emit light and can reveal the chemical composition of astronomical objects.
(Credit: NASA/CXC/SAO/G. Fabbiano)
7
Return to The Antennae (07 Jan 04)
Revised: May 17, 2022