
CXC Home | Search | Help | Image Use Policy | Latest Images | Privacy | Accessibility | Glossary | Q&A
Tour of Cassiopeia A
Quicktime MPEG
A new discovery from a famous exploded star has provided the first evidence for a bizarre state of matter in its core. The news comes from the studies of Cassiopeia A, the remains of a massive star that was seen exploding in Earths sky over 300 years ago. A sequence of observations from NASAs Chandra X-ray Observatory over the past decade shows that the ultradense core of the star left behind after the explosion known as a neutron star has cooled by about 4%. This information, along with theoretical work, indicates that the neutron star contains a mysterious state of matter known as a superfluid. This research will help scientists better understand nuclear interactions in matter at the highest densities known anywhere either here on Earth or out in space.
[Runtime: 00:59]
(Credit:X-ray: NASA/CXC/UNAM/Ioffe/D.Page,P.Shternin et al; Optical: NASA/STScI; Illustration: NASA/CXC/M.Weiss)
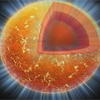
Illustration of Cassiopeia A Neutron Star
Quicktime MPEG
This is an artist's impression of the neutron star at the center of the Cassiopeia A supernova remnant. The different colored layers in the cutout region show the crust (orange), the higher density core (red) and the part of the core where the neutrons are thought to be in a superfluid state (inner red ball). The blue rays emanating from the center of the star represent the copious numbers of neutrinos that are created as the core temperature falls below a critical level and a superfluid is formed.
[Runtime: 00:16]
(Credit: Illustration: NASA/CXC/M.Weiss)
X-ray and Optical Images of Cassiopeia A
Quicktime MPEG
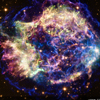
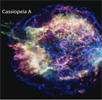
Two independent research teams studied the supernova remnant Cassiopeia A, the remains of a massive star, 11,000 light years away that would have appeared to explode about 330 years as observed from Earth. Chandra data are shown in red, green and blue along with optical data from Hubble in gold. The Chandra data revealed a rapid decline in the temperature of the ultra-dense neutron star that remained after the supernova. The data showed that it had cooled by about 4% over a ten-year period, indicating that a superfluid is forming in its core.
[Runtime: 00:08]
Quicktime MPEG
Two independent research teams studied the supernova remnant Cassiopeia A, the remains of a massive star, 11,000 light years away that would have appeared to explode about 330 years as observed from Earth. Chandra data are shown in red, green and blue along with optical data from Hubble in gold. The Chandra data revealed a rapid decline in the temperature of the ultra-dense neutron star that remained after the supernova. The data showed that it had cooled by about 4% over a ten-year period, indicating that a superfluid is forming in its core.
[Runtime: 00:08]
(Credit: X-ray: NASA/CXC/UNAM/Ioffe/D.Page,P.Shternin et al; Optical:
NASA/STScI)
The Temperature Evolution of the Cas A Neutron Star
Quicktime MPEG
Quicktime MPEG
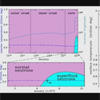
This movie shows the variation in internal and surface temperatures of a model of the Cas A neutron star, as constrained by the latest Chandra observations.
Explanation of the Surface Temperature Plot (right figure):
The graph on the right shows the surface temperature measured in millions of degrees, for times ranging from about 10 years after the supernova explosion to almost 9,300 years after it. The date is shown in years (blue), assuming that the supernova occurred in 1680, as measured in Earth's time-frame, and the blue pentagon follows the temperature variation with time. Temperatures for three different models are shown: "N - normal matter" corresponding to neutron star matter that does not contain any sort of superfluid, "pSF - proton superfluid" for neutron star matter where only the protons are in a superfluid state, and "npSF - neutron/proton superfluid" where the protons and the neutrons are in a superfluid state. The six datapoints from the Chandra observations are shown in red. Clearly the npSF model is preferred by the data, because of the rapid temperature drop.
Explanation of the Internal Temperature Plots (left figures):
The graph in the upper left shows the interior temperature of the neutron star (blue dashed line) as a function of density in the star. The temperature is in billions of degrees and the density is in units of grams per cubic centimeter. Note the incredibly high densities shown here: lead has a density of 11.3 grams per cubic centimeter, trillions of times smaller than the densities in the core of a neutron star (the density of an atomic nucleus is about 3x10^14 grams per cubic centimeter). The outer parts of the star are the lower density regions on the left and the inner parts of the star, including the core, are on the right. The core has a physical size of about 10km while the crust is only about 1 km.
Also shown by the grey solid line is the neutrino brightness, proportional to the number of neutrinos produced per second. The graph in the lower left shows a close-up of the core, where the light blue region is cool enough that a superfluid forms and the purple region is where it is too hot to form. The black dashed line is the critical temperature for superfluid formation.
Following the Temperature Variations:
At very early ages the neutron star core cools so rapidly by neutrino emission that the crust does not have time to react. So, the crust is hotter than the core in 1690 (age = 10 yr) and the surface temperature drops very slowly. The surface temperature of the neutron star then reacts to the "cooling wave" that sweeps through the crust and starts to drop off more quickly. After 1780 the temperature becomes almost constant throughout the neutron star.
Then in 1890, the temperature drops below the critical value for a neutron superfluid to form and a spike in neutrino production occurs in the core, as neutron pairs form. Energy is lost as the neutrinos are emitted, causing the core to cool off and another cooling wave to travel outwards. As large regions of the core become a superfluid the surface temperature then drops off quickly, beginning in about 1930.
Note the clear difference, after about 1720, between the behavior of the
normal matter ("N") and the matter containing the superfluids ("pSF" or
"npSF"). The proton superfluid and superconductor is believed to form soon
after the neutron star is created, and this causes the neutrino production
rate from nuclear interactions to be partially suppressed, so the cooling
rate is not as pronounced as it is for the normal neutron star matter. This
enables the neutron star to stay relatively warm leading to a rapid drop in
temperature once the neutron superfluid forms.
[Runtime: 00:27]
(Credit: NASA/CXC/UNAM/Ioffe/D.Page,P.Shternin et al)
Return to Cassiopeia A (February 23, 2011)
Revised: September 13, 2012