CXC Home | Search | Help | Image Use Policy | Latest Images | Privacy | Accessibility | Glossary | Q&A
1
X-ray, Radio, & Infrared Images of Sagittarius A*(Credit: Chandra X-ray: NASA/CXC/SAO; Swift X-ray: NASA/GSFC/Swift; IR: NASA/HST/STScI; Radio: EHT Collaboration)
These graphics show X-ray data from Chandra depicting hot gas that was blown away from massive stars near the Milky Way's central supermassive black hole known as Sagittarius A* (Sgr A*). Two infrared images at different wavelengths from Hubble reveal stars and cool gas. The new image of Sgr A* from the Event Horizon Telescope, based on data obtained in April 2017, is also included. This latter image shows the area close to the "event horizon," the boundary of a black hole from which nothing can escape. By combining EHT data with those from NASA telescopes and others on the ground, astronomers are learning more about Sgr A* and how it interacts with its environment.
2
Light curves of Sagittarius A* (Sgr A*)(Credit: McGill University/H. Boyce, D. Haggard; EHT Collaboration; NASA/CXC/Swift/NuSTAR; ALMA (ESO/NAOJ/NRAO); ASIAA/SAO/SMA)
Changes in X-ray and radio brightness of Sgr A* with time, for three separate observations on April 6, 7 and 11th, 2017. The variations are shown for X-rays (Chandra, Swift, NuSTAR), and radio (EHT, Atacama Large Millimeter/submillimeter Array (ALMA) and Submillimeter Array (SMA)). The researchers caught two X-ray flares during these observations, a faint one seen with Chandra and Swift, and a moderately bright one seen with Chandra and NuSTAR. The two flares are highlighted in lightly shaded regions. X-ray flares with a similar intensity to the brighter one are regularly observed with Chandra, but this is the first time that the EHT has been simultaneously observing Sgr A*. The intensity and variability observed with the EHT, ALMA and the SMA increase in the few hours immediately after the brighter X-ray flare, a phenomenon not seen in radio observations a few days earlier. Paper II of the newly-released set of EHT papers includes the size of the different variations.
3
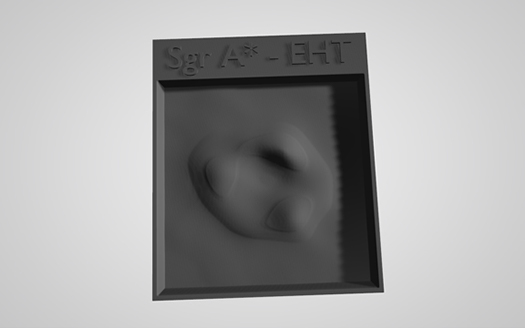
3D Printable Files: Sagittarius A* EHT Close-up Tactile Plate (3D Print Credit: NASA/CXC/A. Jubett, K.Arcand et al., using software by Tactile Universe/N. Bonne & C. Krawczyk & Blender; Photo Credit: EHT Collaboration)
This tactile plate depicts the center of the Milky Way at very close proximity to the central supermassive black hole, Sagittarius A*, as a physical relief map based on the intensity of the radio data captured by the Event Horizon Telescope (EHT). The file for this plate can be downloaded and 3D-printed for learners to touch.
This image showcases Sagittarius A*, the supermassive black hole at the heart of our Milky Way galaxy. Gas in a glowing ring surrounds the black hole’s “event horizon”, a boundary from which nothing can escape. The ring features three bright spots and a fuzzy aura, set against a solid background. The ring is created by light bending in the intense gravity around the black hole at the center, which has a mass some 4 million times greater than that of our Sun.
This image showcases Sagittarius A*, the supermassive black hole at the heart of our Milky Way galaxy. Gas in a glowing ring surrounds the black hole’s “event horizon”, a boundary from which nothing can escape. The ring features three bright spots and a fuzzy aura, set against a solid background. The ring is created by light bending in the intense gravity around the black hole at the center, which has a mass some 4 million times greater than that of our Sun.
4
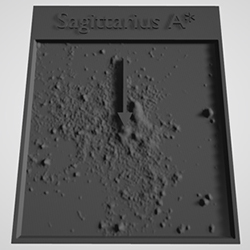
3D Printable Files: Sagittarius A* Chandra Tactile Plate(3D Print Credit: NASA/CXC/A. Jubett, K.Arcand et al., using software by Tactile Universe/N. Bonne & C. Krawczyk & Blender; Photo Credit: NASA/CXC/UCLA/Z.Li et al.)
This tactile plate depicts a larger area surrounding the Milky Way’s central supermassive black hole, Sagittarius A*, as a physical relief map based on the intensity of the X-ray data captured by NASA’s Chandra X-ray Observatory. Sagittarius A*, near the center, is marked with an arrow pointing downward. The file for this plate can be downloaded and 3D-printed for learners to touch.
5
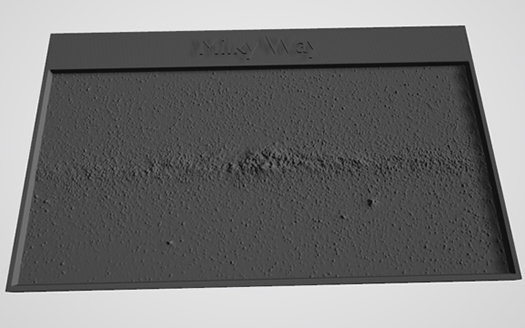
3D Printable Files: Milky Way Tactile Plate (3D Print Credit: NASA/CXC/A. Jubett, K.Arcand et al., using software by Tactile Universe/N. Bonne & C. Krawczyk & Blender; Photo Credit: ESO/S. Brunier)
This tactile plate depicts our Milky Way galaxy as a physical relief map based on the intensity of the data captured in optical light. Sagittarius A* is located at the core of the galaxy in the center of the plate. The file for this plate can be downloaded and 3D-printed for learners to touch.
The background texture is coarse and grainy with a prominent band stretching across the middle of the plate. The bumpy texture represents some of the billions of stars that make up our galactic neighborhood along with an obscuring lane of interstellar dust. The band of the Milky Way is set against a backdrop of more stars.
The background texture is coarse and grainy with a prominent band stretching across the middle of the plate. The bumpy texture represents some of the billions of stars that make up our galactic neighborhood along with an obscuring lane of interstellar dust. The band of the Milky Way is set against a backdrop of more stars.
Return to: NASA Telescopes Support Event Horizon Telescope in Studying Milky Way's Black Hole (May 12, 2022)


