

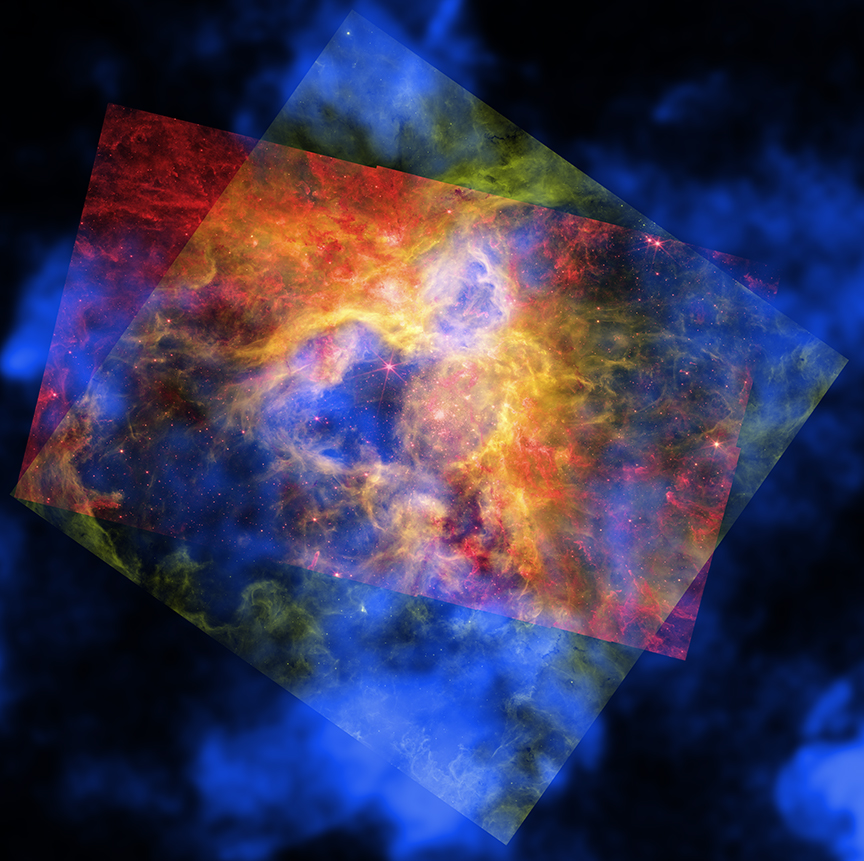
Like a collage made of layered sheets of colored cellophane, a vibrant new image layers observations of a famous star-forming nebula from NASA space telescopes. The resulting cosmic “craft” reveals new details about the star formation region known as 30 Doradus, or the Tarantula Nebula.
Located in the Large Magellanic Cloud, a small neighbor galaxy to the Milky Way about 160,000 light-years from Earth, the Tarantula has thousands of young stars embedded in a vibrant honeycomb-like structure of gas and dust.
The new composite image contains X-rays from NASA’s Chandra X-ray Observatory, which has repeatedly observed the Tarantula Nebula over the course of its mission, in the layer that appears in blue. The X-ray data reveals gas blown away by winds from the surfaces of young, massive stars and heated to millions of degrees by shock waves, like sonic booms from supersonic jets.
The red represents infrared data from NASA’s James Webb Space Telescope showing thousands of young stars, plus swaths of cool dust that will provide the ingredients to form new stars and planets. Optical data in the green layer from NASA’s Hubble Space Telescope uncovers hydrogen gas that is warmer than seen with Webb, as well as some individual stars through the nebula.
The composite image shows the full Hubble and Webb images of this region, as well as a large section of the Chandra image, all recently published in a research paper in the Astrophysical Journal. In some regions the blue Chandra layer stands alone, and in others it combines with either the red Webb data or the green Hubble data. In the middle region all three images overlap to provide a holistic view in red, orange, yellow, green, and blue.
How the Telescope Data is Combined:
Previously, astronomers had studied the amount and the impact of energy produced by winds from young, massive stars in the Tarantula Nebula. Scientists expect that much of this energy should heat gas so that it produces X-rays. However, the research paper shows that there is much less X-ray-emitting gas in the nebula than expected. This led researchers to ask: Where has this energy gone and what tamed the Tarantula Nebula?
By studying the data from Chandra, Hubble, and Webb, combined with data from NASA’s retired Spitzer Space Telescope, the team concluded the Tarantula may be losing energy from several sources.
First, up to half of the hot gas is leaking through the shell walls of the gas and dust structures and escaping the nebula. Next, there is stirring and mixing between the cold gas near the shell walls and some of the hot gas, lowering the overall temperature of the gas. Finally, comparisons with computer simulations suggest the Tarantula may be losing energy through conduction. This involves direct physical contact between hot and cooler material, like with a frying pan on a burner, causing the hot and cooler material to equalize in temperature. In the case of the Tarantula Nebula, the hot gas would be conducting heat by being in direct contact with the cooler gas in the shells, especially in the densest regions. This scenario does not necessarily involve mixing the hot and cooler gas.
The combination of these three channels for losing large amounts of energy leads to this colorful and complex display revealed by NASA's telescopes working together.

The paper describing these results was led by Jennifer Rodriguez of The Ohio State University in Columbus. Additional authors on the paper include Laura Lopez, Ohio State; Lachlan Lancaster, Columbia University in New York City; Anna Rosen, San Diego State University; Omnaraynai Nayak, Space Telescope Science Institute in Baltimore; Sebastian Lopez, Ohio State; Tyler Holland-Ashford, NASA’s Goddard Space Flight Center in Greenbelt, Maryland; and Trinity Webb, Ohio State.
NASA's Marshall Space Flight Center in Huntsville, Alabama, manages the Chandra program. The Smithsonian Astrophysical Observatory's Chandra X-ray Center controls science operations from Cambridge, Massachusetts, and flight operations from Burlington, Massachusetts.
This release features three images of the Tarantula Nebula, or 30 Doradus, a star-forming region of the Large Magellanic Cloud. Each image represents a different wavelength of light, presented in a different color. When layered atop one another, like sheets of colored cellophane, they combine to produce a vibrant and informative singular image.
The base layer of the nearly square, combined image, features a blanket of wispy blue clouds against a black backdrop. These clouds represent hot gas observed by NASA's Chandra X-ray Observatory. This layer reveals that gas has been blown from the surfaces of young, massive stars, and heated to millions of degrees by shock waves.
The second layer is a rectangular image cutting diagonally across the cloudy blue square, tilted from our upper left down toward our lower right. This layer features roiling red clouds and tiny, gleaming, red specks. These are swaths of cool, ingredient-rich dust, and scores of young stars. This red layer represents infrared data collected by NASA's James Webb Space Telescope.
The third layer is a tilted square, or diamond-shaped image, with its points touching the edges of the big blue base layer. Here, curling, sweeping tendrils of warm hydrogen gas swirl around the frame in shades of green. This layer represents data captured by NASA's Hubble Space Telescope.
In the center of the combined image, the three translucent layers overlap, resulting in a technicolor marvel; an image of intermingled blue, red, and green clouds that blend to include lively shades of fiery orange, golden yellow, and deep purple.
|
||||||||||||||||||||||||||||||||

| Share This: |


|




 Download Video (MP4)


